

its importance is enhanced by former poor connection of housing outlets to the storm
water network. An additional factor could be a decreased efficiency of WWTPs
during the largest rain events [37]. The highly significant positive relationship
between river discharge and the E. coli concentration in the Seine River likely results
from a complex combination of factors. This effect is not systematically observed in
all large rivers [49]. Dilution of point sources may provoke a negative correlation.
The positive correlation of E. coli concentrations can be explained by an increased
runoff and erosion in the whole river basin, notably from pastures with cattle
breeding. Another very important factor is the reduced residence time of water
during high-flow periods, which also reduces the extent of the degradation processes
that strongly influence on E. coli concentrations.
7.2 Longitudinal Distributions of E. coli in the Urban
Sections of the Seine and Marne Rivers
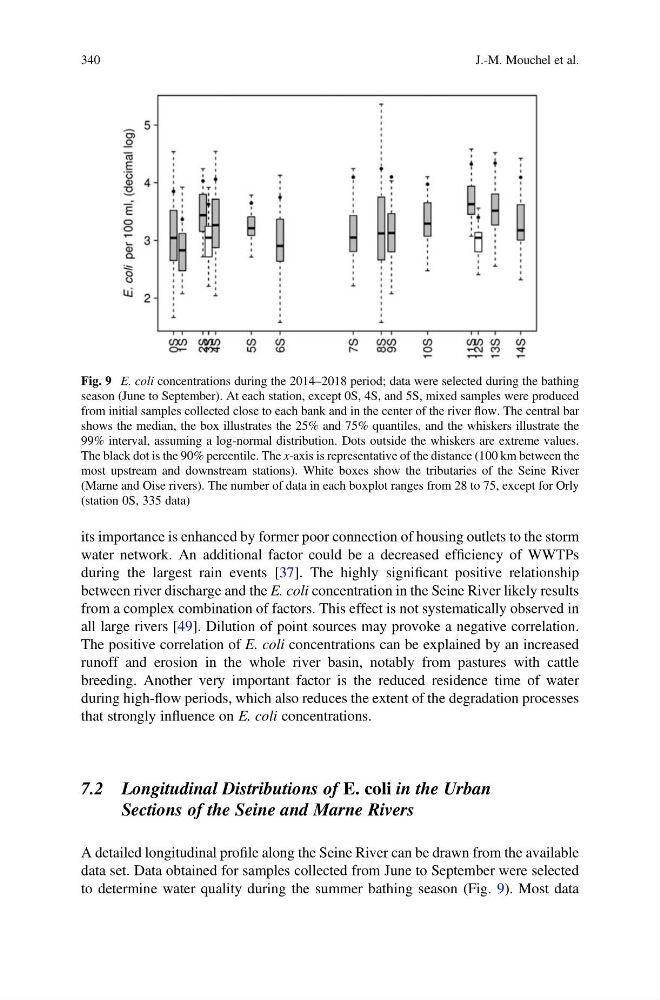
A detailed longitudinal profile along the Seine River can be drawn from the available
data set. Data obtained for samples collected from June to September were selected
to determine water quality during the summer bathing season (Fig. 9). Most data
Fig. 9 E. coli concentrations during the 2014–2018 period; data were selected during the bathing
season (June to September). At each station, except 0S, 4S, and 5S, mixed samples were produced
from initial samples collected close to each bank and in the center of the river flow. The central bar
shows the median, the box illustrates the 25% and 75% quantiles, and the whiskers illustrate the
99% interval, assuming a log-normal distribution. Dots outside the whiskers are extreme values.
The black dot is the 90% percentile. The x-axis is representative of the distance (100 km between the
most upstream and downstream stations). White boxes show the tributaries of the Seine River
(Marne and Oise rivers). The number of data in each boxplot ranges from 28 to 75, except for Orly
(station 0S, 335 data)
340
J.-M. Mouchel et al.
water network. An additional factor could be a decreased efficiency of WWTPs
during the largest rain events [37]. The highly significant positive relationship
between river discharge and the E. coli concentration in the Seine River likely results
from a complex combination of factors. This effect is not systematically observed in
all large rivers [49]. Dilution of point sources may provoke a negative correlation.
The positive correlation of E. coli concentrations can be explained by an increased
runoff and erosion in the whole river basin, notably from pastures with cattle
breeding. Another very important factor is the reduced residence time of water
during high-flow periods, which also reduces the extent of the degradation processes
that strongly influence on E. coli concentrations.
7.2 Longitudinal Distributions of E. coli in the Urban
Sections of the Seine and Marne Rivers
A detailed longitudinal profile along the Seine River can be drawn from the available
data set. Data obtained for samples collected from June to September were selected
to determine water quality during the summer bathing season (Fig. 9). Most data
Fig. 9 E. coli concentrations during the 2014–2018 period; data were selected during the bathing
season (June to September). At each station, except 0S, 4S, and 5S, mixed samples were produced
from initial samples collected close to each bank and in the center of the river flow. The central bar
shows the median, the box illustrates the 25% and 75% quantiles, and the whiskers illustrate the
99% interval, assuming a log-normal distribution. Dots outside the whiskers are extreme values.
The black dot is the 90% percentile. The x-axis is representative of the distance (100 km between the
most upstream and downstream stations). White boxes show the tributaries of the Seine River
(Marne and Oise rivers). The number of data in each boxplot ranges from 28 to 75, except for Orly
(station 0S, 335 data)
340
J.-M. Mouchel et al.