

monitoring, to prevent bathers’ exposure by means of a warning or, where necessary,
bathing prohibition.
But zero risk does not exist. The choice of water quality criteria results from a
complex synthesis regarding the acceptability of risk and the existing epidemiological knowledge. Therefore, standards may differ in different countries. As stated by
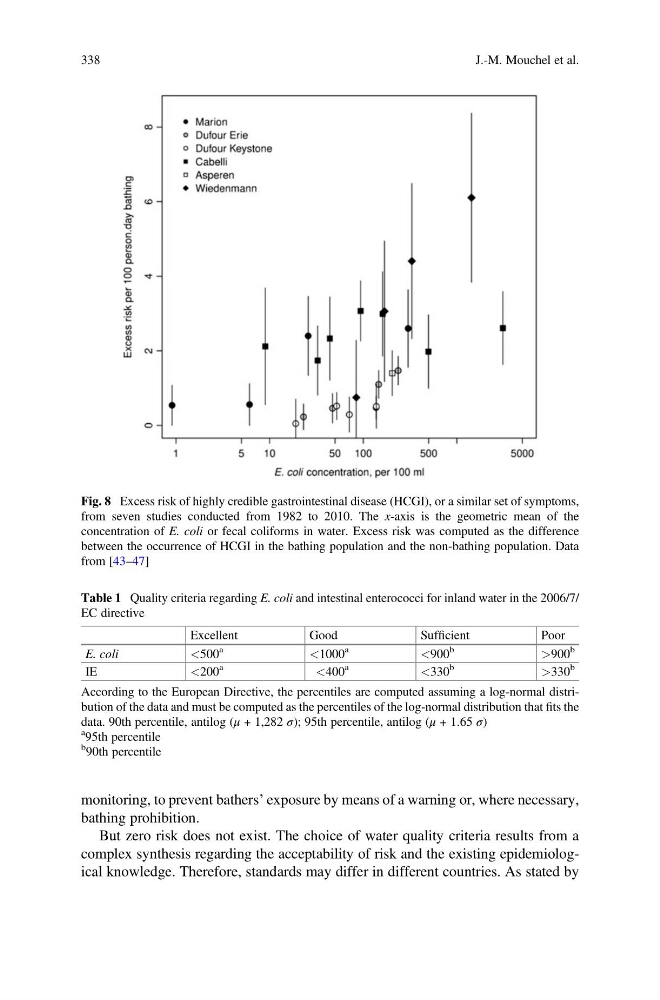
Fig. 8 Excess risk of highly credible gastrointestinal disease (HCGI), or a similar set of symptoms,
from seven studies conducted from 1982 to 2010. The x-axis is the geometric mean of the
concentration of E. coli or fecal coliforms in water. Excess risk was computed as the difference
between the occurrence of HCGI in the bathing population and the non-bathing population. Data
from [43–47]
Table 1 Quality criteria regarding E. coli and intestinal enterococci for inland water in the 2006/7/
EC directive
Excellent
Good
Sufficient
Poor
E. coli
<500
a
<1000
a
<900
b
>900
b
IE
<200
a
<400
a
<330
b
>330
b
According to the European Directive, the percentiles are computed assuming a log-normal distribution of the data and must be computed as the percentiles of the log-normal distribution that fits the
data. 90th percentile, antilog (μ + 1,282 σ); 95th percentile, antilog (μ + 1.65 σ)
a 95th percentile
b
90th percentile
338
J.-M. Mouchel et al.
bathing prohibition.
But zero risk does not exist. The choice of water quality criteria results from a
complex synthesis regarding the acceptability of risk and the existing epidemiological knowledge. Therefore, standards may differ in different countries. As stated by
Fig. 8 Excess risk of highly credible gastrointestinal disease (HCGI), or a similar set of symptoms,
from seven studies conducted from 1982 to 2010. The x-axis is the geometric mean of the
concentration of E. coli or fecal coliforms in water. Excess risk was computed as the difference
between the occurrence of HCGI in the bathing population and the non-bathing population. Data
from [43–47]
Table 1 Quality criteria regarding E. coli and intestinal enterococci for inland water in the 2006/7/
EC directive
Excellent
Good
Sufficient
Poor
E. coli
<500
a
<1000
a
<900
b
>900
b
IE
<200
a
<400
a
<330
b
>330
b
According to the European Directive, the percentiles are computed assuming a log-normal distribution of the data and must be computed as the percentiles of the log-normal distribution that fits the
data. 90th percentile, antilog (μ + 1,282 σ); 95th percentile, antilog (μ + 1.65 σ)
a 95th percentile
b
90th percentile
338
J.-M. Mouchel et al.