

colonised the Seine River since the recovery of high oxygen levels. It is now
regularly observed in the urban part of the river, in rip-rap located along banks
that provide suitable habitats.
However, during the same period, some species have shown clear signs of
decline. This is particularly the case for burbot (Lota lota) and black bullhead
(Ameiurus melas), which were regularly observed in the 1980s and 1990s and are
now caught much more occasionally (particularly for burbot, which is close to
extirpation in this river reach).
At two sites of the Seine River, approximately 150 km apart, the temporal
changes in fish communities over 15 years were closely synchronised [38]. As
water quality had changed little in these sectors, this suggests that the long-term
dynamics of fish communities were governed by other factors, particularly
hydroclimatic factors (flood, low water level, heat waves, etc.), which act on a
large spatial scale.
The relative contribution of global warming to the evolution of fish communities
in the Seine over the past few decades remains an open question. Because there are
more cool and warm water species than cold water species in French freshwater fish
fauna, some modelling approaches predict for rivers a general increase in local fish
species richness with climate warming [39, 40]. In a way, the trend towards an
increase in the number of fish species detected along the whole Seine River course
over the past four decades could be part of this process. Studies focusing on recent
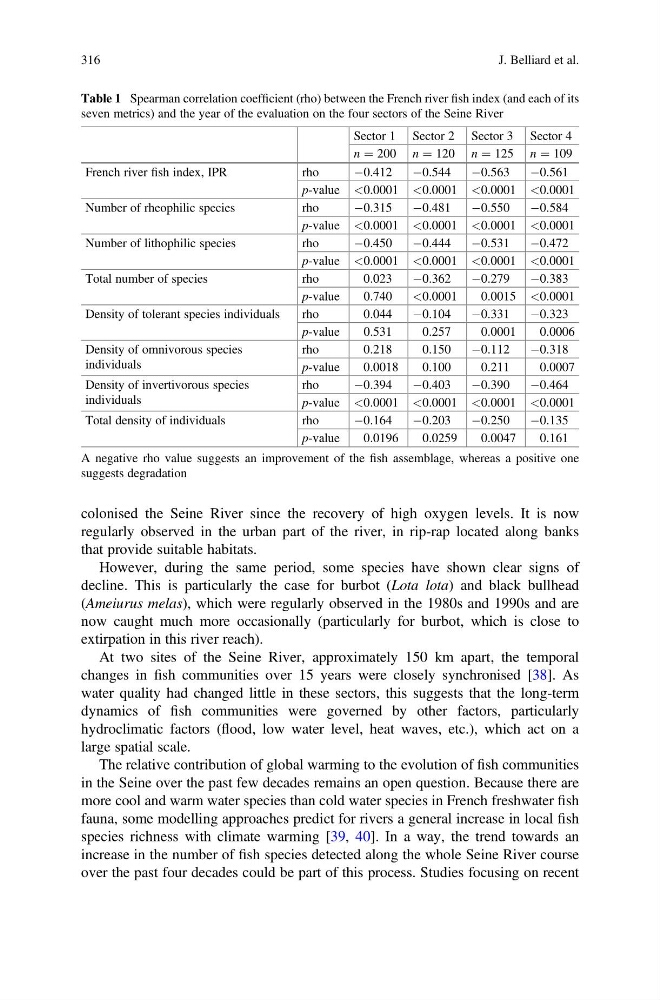
Table 1 Spearman correlation coefficient (rho) between the French river fish index (and each of its
seven metrics) and the year of the evaluation on the four sectors of the Seine River
Sector 1 Sector 2 Sector 3 Sector 4
n ¼ 200 n ¼ 120 n ¼ 125 n ¼ 109
French river fish index, IPR
rho
À0.412
À0.544
À0.563
À0.561
p-value <0.0001 <0.0001 <0.0001 <0.0001
Number of rheophilic species
rho
À0.315
À0.481
À0.550
À0.584
p-value <0.0001 <0.0001 <0.0001 <0.0001
Number of lithophilic species
rho
À0.450
À0.444
À0.531
À0.472
p-value <0.0001 <0.0001 <0.0001 <0.0001
Total number of species
rho
0.023
À0.362
À0.279
À0.383
p-value
0.740
<0.0001
0.0015 <0.0001
Density of tolerant species individuals
rho
0.044
À0.104
À0.331
À0.323
p-value
0.531
0.257
0.0001
0.0006
Density of omnivorous species
individuals
rho
0.218
0.150
À0.112
À0.318
p-value
0.0018
0.100
0.211
0.0007
Density of invertivorous species
individuals
rho
À0.394
À0.403
À0.390
À0.464
p-value <0.0001 <0.0001 <0.0001 <0.0001
Total density of individuals
rho
À0.164
À0.203
À0.250
À0.135
p-value
0.0196
0.0259
0.0047
0.161
A negative rho value suggests an improvement of the fish assemblage, whereas a positive one
suggests degradation
316
J. Belliard et al.
regularly observed in the urban part of the river, in rip-rap located along banks
that provide suitable habitats.
However, during the same period, some species have shown clear signs of
decline. This is particularly the case for burbot (Lota lota) and black bullhead
(Ameiurus melas), which were regularly observed in the 1980s and 1990s and are
now caught much more occasionally (particularly for burbot, which is close to
extirpation in this river reach).
At two sites of the Seine River, approximately 150 km apart, the temporal
changes in fish communities over 15 years were closely synchronised [38]. As
water quality had changed little in these sectors, this suggests that the long-term
dynamics of fish communities were governed by other factors, particularly
hydroclimatic factors (flood, low water level, heat waves, etc.), which act on a
large spatial scale.
The relative contribution of global warming to the evolution of fish communities
in the Seine over the past few decades remains an open question. Because there are
more cool and warm water species than cold water species in French freshwater fish
fauna, some modelling approaches predict for rivers a general increase in local fish
species richness with climate warming [39, 40]. In a way, the trend towards an
increase in the number of fish species detected along the whole Seine River course
over the past four decades could be part of this process. Studies focusing on recent
Table 1 Spearman correlation coefficient (rho) between the French river fish index (and each of its
seven metrics) and the year of the evaluation on the four sectors of the Seine River
Sector 1 Sector 2 Sector 3 Sector 4
n ¼ 200 n ¼ 120 n ¼ 125 n ¼ 109
French river fish index, IPR
rho
À0.412
À0.544
À0.563
À0.561
p-value <0.0001 <0.0001 <0.0001 <0.0001
Number of rheophilic species
rho
À0.315
À0.481
À0.550
À0.584
p-value <0.0001 <0.0001 <0.0001 <0.0001
Number of lithophilic species
rho
À0.450
À0.444
À0.531
À0.472
p-value <0.0001 <0.0001 <0.0001 <0.0001
Total number of species
rho
0.023
À0.362
À0.279
À0.383
p-value
0.740
<0.0001
0.0015 <0.0001
Density of tolerant species individuals
rho
0.044
À0.104
À0.331
À0.323
p-value
0.531
0.257
0.0001
0.0006
Density of omnivorous species
individuals
rho
0.218
0.150
À0.112
À0.318
p-value
0.0018
0.100
0.211
0.0007
Density of invertivorous species
individuals
rho
À0.394
À0.403
À0.390
À0.464
p-value <0.0001 <0.0001 <0.0001 <0.0001
Total density of individuals
rho
À0.164
À0.203
À0.250
À0.135
p-value
0.0196
0.0259
0.0047
0.161
A negative rho value suggests an improvement of the fish assemblage, whereas a positive one
suggests degradation
316
J. Belliard et al.