

basin may have its own maximum period, depending on local environmental and
political history [72].
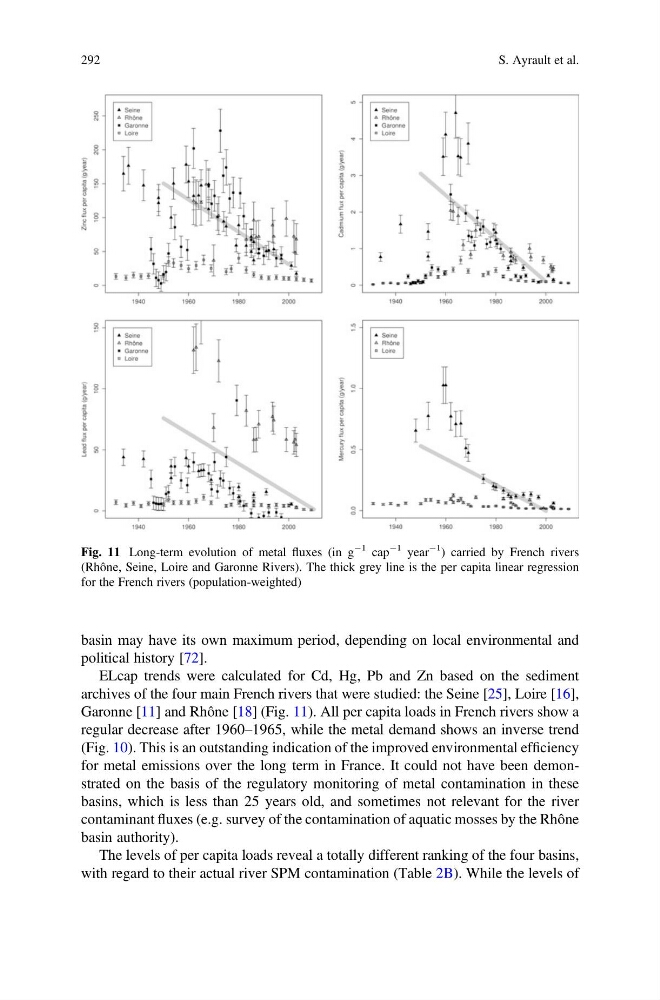
ELcap trends were calculated for Cd, Hg, Pb and Zn based on the sediment
archives of the four main French rivers that were studied: the Seine [25], Loire [16],
Garonne [11] and Rhône [18] (Fig. 11). All per capita loads in French rivers show a
regular decrease after 1960–1965, while the metal demand shows an inverse trend
(Fig. 10). This is an outstanding indication of the improved environmental efficiency
for metal emissions over the long term in France. It could not have been demonstrated on the basis of the regulatory monitoring of metal contamination in these
basins, which is less than 25 years old, and sometimes not relevant for the river
contaminant fluxes (e.g. survey of the contamination of aquatic mosses by the Rhône
basin authority).
The levels of per capita loads reveal a totally different ranking of the four basins,
with regard to their actual river SPM contamination (Table 2B). While the levels of
Fig. 11 Long-term evolution of metal fluxes (in g
À1 cap
À1 year
À1
) carried by French rivers
(Rhône, Seine, Loire and Garonne Rivers). The thick grey line is the per capita linear regression
for the French rivers (population-weighted)
292
S. Ayrault et al.
political history [72].
ELcap trends were calculated for Cd, Hg, Pb and Zn based on the sediment
archives of the four main French rivers that were studied: the Seine [25], Loire [16],
Garonne [11] and Rhône [18] (Fig. 11). All per capita loads in French rivers show a
regular decrease after 1960–1965, while the metal demand shows an inverse trend
(Fig. 10). This is an outstanding indication of the improved environmental efficiency
for metal emissions over the long term in France. It could not have been demonstrated on the basis of the regulatory monitoring of metal contamination in these
basins, which is less than 25 years old, and sometimes not relevant for the river
contaminant fluxes (e.g. survey of the contamination of aquatic mosses by the Rhône
basin authority).
The levels of per capita loads reveal a totally different ranking of the four basins,
with regard to their actual river SPM contamination (Table 2B). While the levels of
Fig. 11 Long-term evolution of metal fluxes (in g
À1 cap
À1 year
À1
) carried by French rivers
(Rhône, Seine, Loire and Garonne Rivers). The thick grey line is the per capita linear regression
for the French rivers (population-weighted)
292
S. Ayrault et al.