

large rivers favourable to phytoplankton development and again to heterotrophy in
estuaries, where organic matter accumulation and increased depth and turbidity
reduced the possibility of photosynthesis. While this scheme is valid for pristine or
slightly human-impacted rivers, it is largely affected by anthropogenic nutrient and
organic matter contamination [67]. Downstream of the Paris urban area, Europe’s
largest WWTP’s outflows into the Seine River can contribute up to one-third of the
total river discharge during extreme low-flow periods.
0
500
1000
1500
2000
2500
1987
1988
1989
1990
m 3
s -1
Poses
calc
obs
0
2
4
6
8
10
1987
1988
1989
1990
mg N-NO
3 l -1
0
2
4
6
8
10
1987
1988
1989
1990
mg N-NH4 l -1
0
50
100
150
1 9 8 7
1 9 8 8
1 9 8 9
1 9 9 0
µg Chla l -1
0.0
0.5
1.0
1.5
2.0
2.5
1987
1988
1989
1990
mg P-PO
4 l -1
0
2
4
6
8
10
1987
1988
1989
1990
mg Si l -1
0
500
1000
1500
2000
2500
2010
2011
2012
2013
m 3
s -1
Poses
0
2
4
6
8
10
2010
2011
2012
2013
mg N-NO
3 l -1
0
50
100
150
2010
2011
2012
2013
µg Chl a l -1
0
2
4
6
8
10
2010
2011
2012
2013
mg N-NH
4 l -1
Observations
Ref simulations
0.0
0.5
1.0
1.5
2.0
2.5
2010
2011
2012
2013
mg P-PO
4 l -1
0
2
4
6
8
10
2010
2011
2012
2013
mg Si l -1
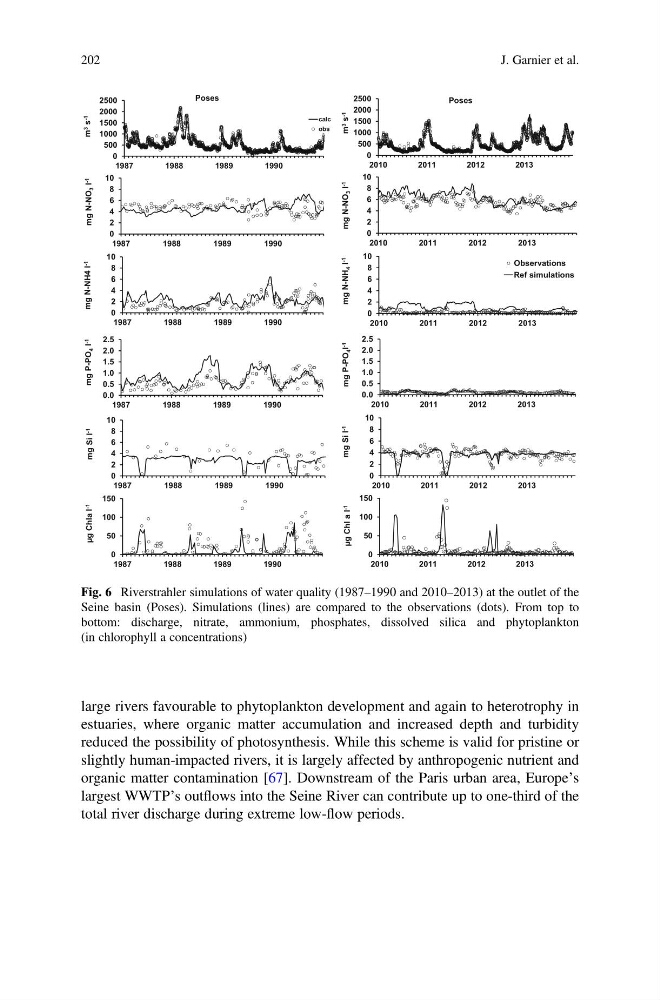
Fig. 6 Riverstrahler simulations of water quality (1987–1990 and 2010–2013) at the outlet of the
Seine basin (Poses). Simulations (lines) are compared to the observations (dots). From top to
bottom: discharge, nitrate, ammonium, phosphates, dissolved silica and phytoplankton
(in chlorophyll a concentrations)
202
J. Garnier et al.
estuaries, where organic matter accumulation and increased depth and turbidity
reduced the possibility of photosynthesis. While this scheme is valid for pristine or
slightly human-impacted rivers, it is largely affected by anthropogenic nutrient and
organic matter contamination [67]. Downstream of the Paris urban area, Europe’s
largest WWTP’s outflows into the Seine River can contribute up to one-third of the
total river discharge during extreme low-flow periods.
0
500
1000
1500
2000
2500
1987
1988
1989
1990
m 3
s -1
Poses
calc
obs
0
2
4
6
8
10
1987
1988
1989
1990
mg N-NO
3 l -1
0
2
4
6
8
10
1987
1988
1989
1990
mg N-NH4 l -1
0
50
100
150
1 9 8 7
1 9 8 8
1 9 8 9
1 9 9 0
µg Chla l -1
0.0
0.5
1.0
1.5
2.0
2.5
1987
1988
1989
1990
mg P-PO
4 l -1
0
2
4
6
8
10
1987
1988
1989
1990
mg Si l -1
0
500
1000
1500
2000
2500
2010
2011
2012
2013
m 3
s -1
Poses
0
2
4
6
8
10
2010
2011
2012
2013
mg N-NO
3 l -1
0
50
100
150
2010
2011
2012
2013
µg Chl a l -1
0
2
4
6
8
10
2010
2011
2012
2013
mg N-NH
4 l -1
Observations
Ref simulations
0.0
0.5
1.0
1.5
2.0
2.5
2010
2011
2012
2013
mg P-PO
4 l -1
0
2
4
6
8
10
2010
2011
2012
2013
mg Si l -1
Fig. 6 Riverstrahler simulations of water quality (1987–1990 and 2010–2013) at the outlet of the
Seine basin (Poses). Simulations (lines) are compared to the observations (dots). From top to
bottom: discharge, nitrate, ammonium, phosphates, dissolved silica and phytoplankton
(in chlorophyll a concentrations)
202
J. Garnier et al.