

2.4 Flux Estimation Quality
The mathematical uncertainties estimated as previously described failed to reflect the
quality of the database used for the flux calculation. To express this quality, grades
were attributed according to five parameters including the database size, the number
of studies, the sampling date in comparison with 2014, the spatial and temporal
representativeness of the samples and the quality of the parameters that were used in
the estimations (e.g. runoff). Each parameter was rated from 0 to 4 (low to high
quality). The global quality grade was estimated as the lowest rate for individual
parameters. The fluxes based on a numeric model or economic data were awarded a
quality grade of 0 because no actual measurement could back up the results.
3 Results
3.1 Urban Fluxes
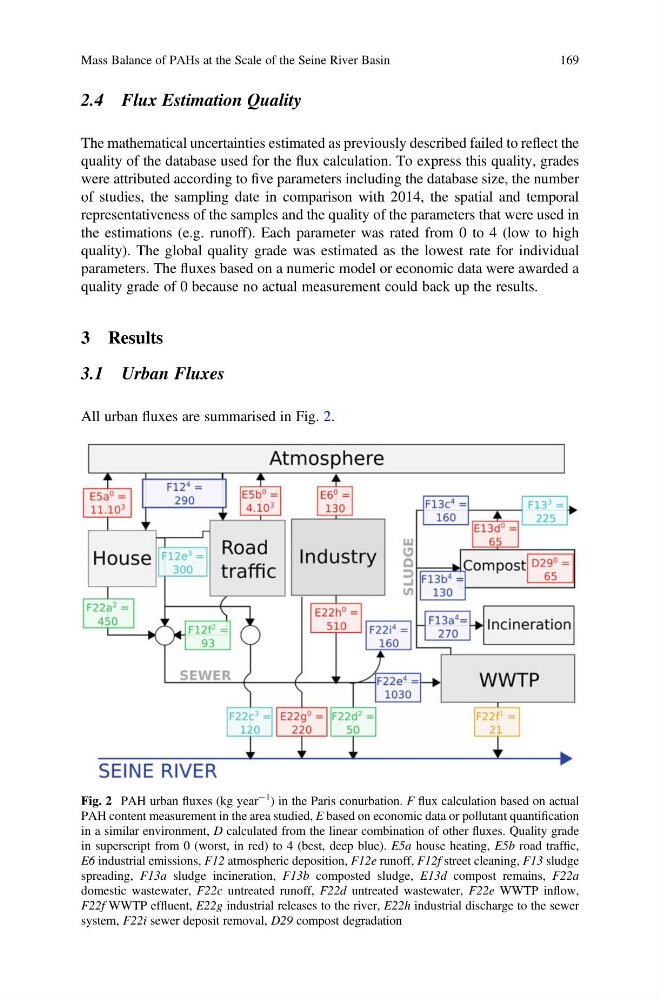
All urban fluxes are summarised in Fig. 2.
Fig. 2 PAH urban fluxes (kg year
À1
) in the Paris conurbation. F flux calculation based on actual
PAH content measurement in the area studied, E based on economic data or pollutant quantification
in a similar environment, D calculated from the linear combination of other fluxes. Quality grade
in superscript from 0 (worst, in red) to 4 (best, deep blue). E5a house heating, E5b road traffic,
E6 industrial emissions, F12 atmospheric deposition, F12e runoff, F12f street cleaning, F13 sludge
spreading, F13a sludge incineration, F13b composted sludge, E13d compost remains, F22a
domestic wastewater, F22c untreated runoff, F22d untreated wastewater, F22e WWTP inflow,
F22f WWTP effluent, E22g industrial releases to the river, E22h industrial discharge to the sewer
system, F22i sewer deposit removal, D29 compost degradation
Mass Balance of PAHs at the Scale of the Seine River Basin
169
The mathematical uncertainties estimated as previously described failed to reflect the
quality of the database used for the flux calculation. To express this quality, grades
were attributed according to five parameters including the database size, the number
of studies, the sampling date in comparison with 2014, the spatial and temporal
representativeness of the samples and the quality of the parameters that were used in
the estimations (e.g. runoff). Each parameter was rated from 0 to 4 (low to high
quality). The global quality grade was estimated as the lowest rate for individual
parameters. The fluxes based on a numeric model or economic data were awarded a
quality grade of 0 because no actual measurement could back up the results.
3 Results
3.1 Urban Fluxes
All urban fluxes are summarised in Fig. 2.
Fig. 2 PAH urban fluxes (kg year
À1
) in the Paris conurbation. F flux calculation based on actual
PAH content measurement in the area studied, E based on economic data or pollutant quantification
in a similar environment, D calculated from the linear combination of other fluxes. Quality grade
in superscript from 0 (worst, in red) to 4 (best, deep blue). E5a house heating, E5b road traffic,
E6 industrial emissions, F12 atmospheric deposition, F12e runoff, F12f street cleaning, F13 sludge
spreading, F13a sludge incineration, F13b composted sludge, E13d compost remains, F22a
domestic wastewater, F22c untreated runoff, F22d untreated wastewater, F22e WWTP inflow,
F22f WWTP effluent, E22g industrial releases to the river, E22h industrial discharge to the sewer
system, F22i sewer deposit removal, D29 compost degradation
Mass Balance of PAHs at the Scale of the Seine River Basin
169