

The limit values of HQ, THQ, and HI are 1, while that of ILTCR is 10
À4 (Briki
et al. 2017; Mansouri et al. 2015). Values below these limits represent that the
exposed population is unlikely to endure any toxic effect.
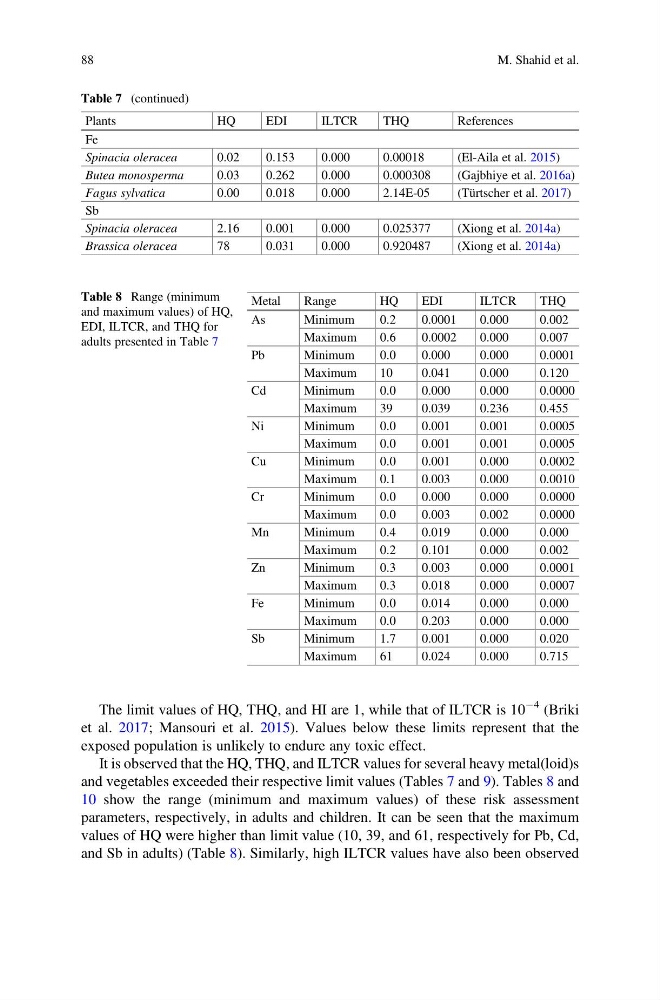
It is observed that the HQ, THQ, and ILTCR values for several heavy metal(loid)s
and vegetables exceeded their respective limit values (Tables 7 and 9). Tables 8 and
10 show the range (minimum and maximum values) of these risk assessment
parameters, respectively, in adults and children. It can be seen that the maximum
values of HQ were higher than limit value (10, 39, and 61, respectively for Pb, Cd,
and Sb in adults) (Table 8). Similarly, high ILTCR values have also been observed
Table 7 (continued)
Plants
HQ
EDI
ILTCR
THQ
References
Fe
Spinacia oleracea
0.02
0.153
0.000
0.00018
(El-Aila et al. 2015)
Butea monosperma
0.03
0.262
0.000
0.000308
(Gajbhiye et al. 2016a)
Fagus sylvatica
0.00
0.018
0.000
2.14E-05
(Türtscher et al. 2017)
Sb
Spinacia oleracea
2.16
0.001
0.000
0.025377
(Xiong et al. 2014a)
Brassica oleracea
78
0.031
0.000
0.920487
(Xiong et al. 2014a)
Table 8 Range (minimum
and maximum values) of HQ,
EDI, ILTCR, and THQ for
adults presented in Table 7
Metal
Range
HQ
EDI
ILTCR
THQ
As
Minimum
0.2
0.0001
0.000
0.002
Maximum
0.6
0.0002
0.000
0.007
Pb
Minimum
0.0
0.000
0.000
0.0001
Maximum
10
0.041
0.000
0.120
Cd
Minimum
0.0
0.000
0.000
0.0000
Maximum
39
0.039
0.236
0.455
Ni
Minimum
0.0
0.001
0.001
0.0005
Maximum
0.0
0.001
0.001
0.0005
Cu
Minimum
0.0
0.001
0.000
0.0002
Maximum
0.1
0.003
0.000
0.0010
Cr
Minimum
0.0
0.000
0.000
0.0000
Maximum
0.0
0.003
0.002
0.0000
Mn
Minimum
0.4
0.019
0.000
0.000
Maximum
0.2
0.101
0.000
0.002
Zn
Minimum
0.3
0.003
0.000
0.0001
Maximum
0.3
0.018
0.000
0.0007
Fe
Minimum
0.0
0.014
0.000
0.000
Maximum
0.0
0.203
0.000
0.000
Sb
Minimum
1.7
0.001
0.000
0.020
Maximum
61
0.024
0.000
0.715
88
M. Shahid et al.
À4 (Briki
et al. 2017; Mansouri et al. 2015). Values below these limits represent that the
exposed population is unlikely to endure any toxic effect.
It is observed that the HQ, THQ, and ILTCR values for several heavy metal(loid)s
and vegetables exceeded their respective limit values (Tables 7 and 9). Tables 8 and
10 show the range (minimum and maximum values) of these risk assessment
parameters, respectively, in adults and children. It can be seen that the maximum
values of HQ were higher than limit value (10, 39, and 61, respectively for Pb, Cd,
and Sb in adults) (Table 8). Similarly, high ILTCR values have also been observed
Table 7 (continued)
Plants
HQ
EDI
ILTCR
THQ
References
Fe
Spinacia oleracea
0.02
0.153
0.000
0.00018
(El-Aila et al. 2015)
Butea monosperma
0.03
0.262
0.000
0.000308
(Gajbhiye et al. 2016a)
Fagus sylvatica
0.00
0.018
0.000
2.14E-05
(Türtscher et al. 2017)
Sb
Spinacia oleracea
2.16
0.001
0.000
0.025377
(Xiong et al. 2014a)
Brassica oleracea
78
0.031
0.000
0.920487
(Xiong et al. 2014a)
Table 8 Range (minimum
and maximum values) of HQ,
EDI, ILTCR, and THQ for
adults presented in Table 7
Metal
Range
HQ
EDI
ILTCR
THQ
As
Minimum
0.2
0.0001
0.000
0.002
Maximum
0.6
0.0002
0.000
0.007
Pb
Minimum
0.0
0.000
0.000
0.0001
Maximum
10
0.041
0.000
0.120
Cd
Minimum
0.0
0.000
0.000
0.0000
Maximum
39
0.039
0.236
0.455
Ni
Minimum
0.0
0.001
0.001
0.0005
Maximum
0.0
0.001
0.001
0.0005
Cu
Minimum
0.0
0.001
0.000
0.0002
Maximum
0.1
0.003
0.000
0.0010
Cr
Minimum
0.0
0.000
0.000
0.0000
Maximum
0.0
0.003
0.002
0.0000
Mn
Minimum
0.4
0.019
0.000
0.000
Maximum
0.2
0.101
0.000
0.002
Zn
Minimum
0.3
0.003
0.000
0.0001
Maximum
0.3
0.018
0.000
0.0007
Fe
Minimum
0.0
0.014
0.000
0.000
Maximum
0.0
0.203
0.000
0.000
Sb
Minimum
1.7
0.001
0.000
0.020
Maximum
61
0.024
0.000
0.715
88
M. Shahid et al.