

RESULTS AND DISCUSSION
0
0,2
0,4
0,6
0,8
1
1,2
0,00
0,20
0,40
0,60
0,80
1,00
EQR
PREI
Integrated exposure index
Hu et al with urbanization in municipality
Hu et al with urbanization in 10Km
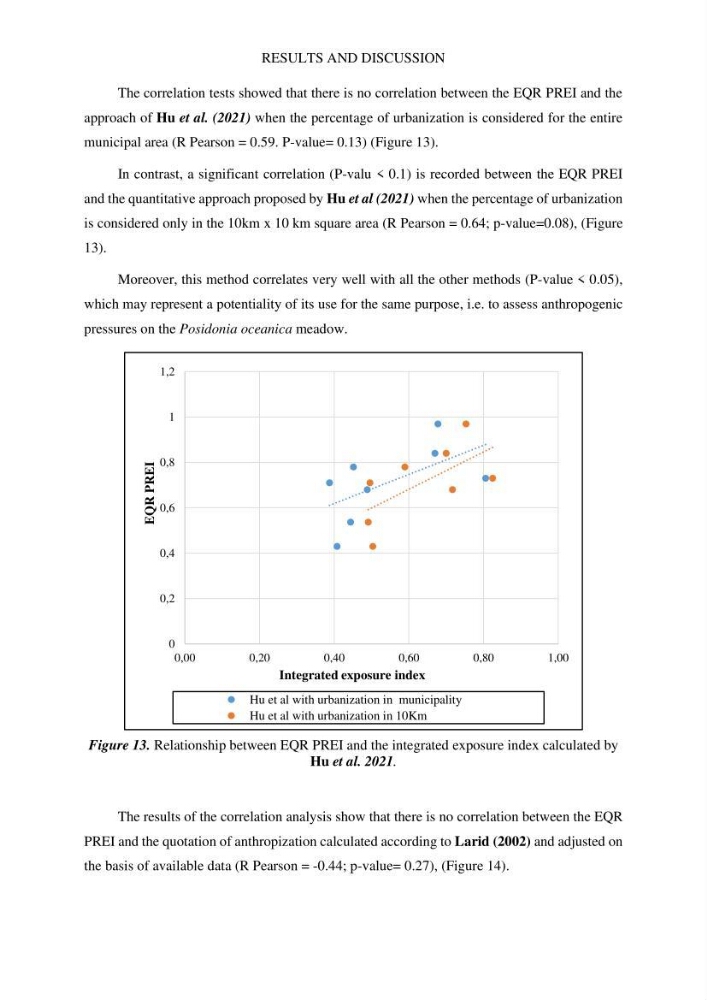
The correlation tests showed that there is no correlation between the EQR PREI and the
approach of Hu et al. (2021) when the percentage of urbanization is considered for the entire
municipal area (R Pearson = 0.59. P-value= 0.13) (Figure 13).
In contrast, a significant correlation (P-valu < 0.1) is recorded between the EQR PREI
and the quantitative approach proposed by Hu et al (2021) when the percentage of urbanization
is considered only in the 10km x 10 km square area (R Pearson = 0.64; p-value=0.08), (Figure
13).
Moreover, this method correlates very well with all the other methods (P-value < 0.05),
which may represent a potentiality of its use for the same purpose, i.e. to assess anthropogenic
pressures on the Posidonia oceanica meadow.
Figure 13. Relationship between EQR PREI and the integrated exposure index calculated by
Hu et al. 2021.
The results of the correlation analysis show that there is no correlation between the EQR
PREI and the quotation of anthropization calculated according to Larid (2002) and adjusted on
the basis of available data (R Pearson = -0.44; p-value= 0.27), (Figure 14).
0
0,2
0,4
0,6
0,8
1
1,2
0,00
0,20
0,40
0,60
0,80
1,00
EQR
PREI
Integrated exposure index
Hu et al with urbanization in municipality
Hu et al with urbanization in 10Km
The correlation tests showed that there is no correlation between the EQR PREI and the
approach of Hu et al. (2021) when the percentage of urbanization is considered for the entire
municipal area (R Pearson = 0.59. P-value= 0.13) (Figure 13).
In contrast, a significant correlation (P-valu < 0.1) is recorded between the EQR PREI
and the quantitative approach proposed by Hu et al (2021) when the percentage of urbanization
is considered only in the 10km x 10 km square area (R Pearson = 0.64; p-value=0.08), (Figure
13).
Moreover, this method correlates very well with all the other methods (P-value < 0.05),
which may represent a potentiality of its use for the same purpose, i.e. to assess anthropogenic
pressures on the Posidonia oceanica meadow.
Figure 13. Relationship between EQR PREI and the integrated exposure index calculated by
Hu et al. 2021.
The results of the correlation analysis show that there is no correlation between the EQR
PREI and the quotation of anthropization calculated according to Larid (2002) and adjusted on
the basis of available data (R Pearson = -0.44; p-value= 0.27), (Figure 14).