

RESULTS AND DISCUSSION
0,00
0,10
0,20
0,30
0,40
0,50
0,60
0,70
0,80
0,90
CH
AK
BR
BSM
LP
AB
PP
AG
DLS
Integrated
exposure
index
Urbanization in 10km squares (%). Urbanization in the entire municipal area (%).
3.2. Anthropogenic pressures assessment supplemented by data census
3.2.1. Using the method described by Hu et al. (2021) and adjusted
This quantitative approach uses an inverted scale. On this scale. the closer the value of
the Integrated Exposure Index is to 1, the less the site is affected by anthropogenic pressures.
Conversely. the further the value of the Integrated Exposure Index is from 1, the more the site
is affected by anthropogenic pressures.
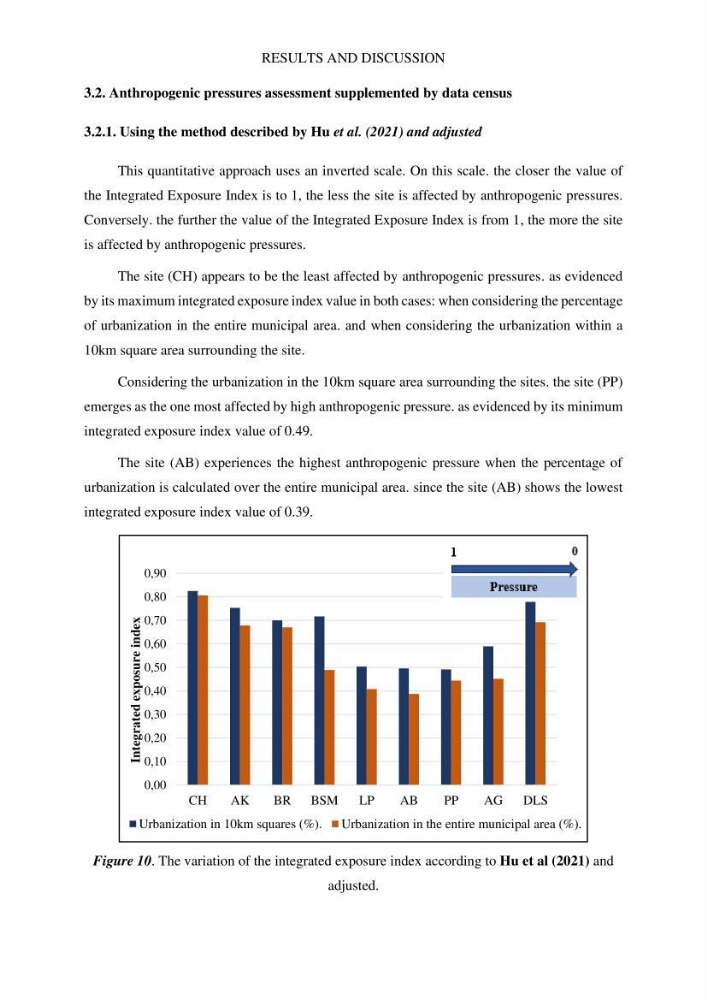
The site (CH) appears to be the least affected by anthropogenic pressures. as evidenced
by its maximum integrated exposure index value in both cases: when considering the percentage
of urbanization in the entire municipal area. and when considering the urbanization within a
10km square area surrounding the site.
Considering the urbanization in the 10km square area surrounding the sites. the site (PP)
emerges as the one most affected by high anthropogenic pressure. as evidenced by its minimum
integrated exposure index value of 0.49.
The site (AB) experiences the highest anthropogenic pressure when the percentage of
urbanization is calculated over the entire municipal area. since the site (AB) shows the lowest
integrated exposure index value of 0.39.
Figure 10. The variation of the integrated exposure index according to Hu et al (2021) and
adjusted.
0,00
0,10
0,20
0,30
0,40
0,50
0,60
0,70
0,80
0,90
CH
AK
BR
BSM
LP
AB
PP
AG
DLS
Integrated
exposure
index
Urbanization in 10km squares (%). Urbanization in the entire municipal area (%).
3.2. Anthropogenic pressures assessment supplemented by data census
3.2.1. Using the method described by Hu et al. (2021) and adjusted
This quantitative approach uses an inverted scale. On this scale. the closer the value of
the Integrated Exposure Index is to 1, the less the site is affected by anthropogenic pressures.
Conversely. the further the value of the Integrated Exposure Index is from 1, the more the site
is affected by anthropogenic pressures.
The site (CH) appears to be the least affected by anthropogenic pressures. as evidenced
by its maximum integrated exposure index value in both cases: when considering the percentage
of urbanization in the entire municipal area. and when considering the urbanization within a
10km square area surrounding the site.
Considering the urbanization in the 10km square area surrounding the sites. the site (PP)
emerges as the one most affected by high anthropogenic pressure. as evidenced by its minimum
integrated exposure index value of 0.49.
The site (AB) experiences the highest anthropogenic pressure when the percentage of
urbanization is calculated over the entire municipal area. since the site (AB) shows the lowest
integrated exposure index value of 0.39.
Figure 10. The variation of the integrated exposure index according to Hu et al (2021) and
adjusted.