

of water. In addition, information from reservoir
surveys would inform managers on the sedimentation status of the reservoir. Physical–
chemical analysis of the sediment samples could
indicate if there is potential for water quality
change due to contaminants inflow into the
reservoir.
The results from surveys also give information on the impacts of anthropogenic activities
upstream. This can be assessed from sediment
cores and can aid in understanding the dynamics
of sedimentation rates during a given time period. McAlister et al. (2013) reported that bathymetric surveys are useful in providing direct
accurate assessments of sediment export within
the watershed. When bathymetric surveys are
combined with sediment cores to measure sediment thickness, accurate reservoir capacity and
long-term water volume loss can be determined
in a single survey. The advance in technology
and survey techniques has made sedimentation
assessment attractive for decision making.
1.3 Challenges to Reservoir Sediment
Assessment in Kenya
Kenya has implemented various counter measures to curb sedimentation in natural lakes and
reservoirs across the country. The main counter
measure implemented aims at conserving the
upstream catchment. These measures lower soil
loss and thus reduce sediment inflow into the
reservoirs. In some reservoirs, sediment removal
by scouring within the reservoir is regularly
undertaken. Even with the different counter
measures to curb sedimentation of the reservoirs,
little is known about their sedimentation rates.
The country’s ability to monitor sedimentation is
limited. In Kenya, some of the limiting factors
range from infrastructure to human resource
capacity (Sang et al. 2017). Generally, little has
been done on the training of technical expertise
to undertake reservoir survey. Other factors that
limit the execution of reservoir surveys include
the high cost of external expertise, lack of
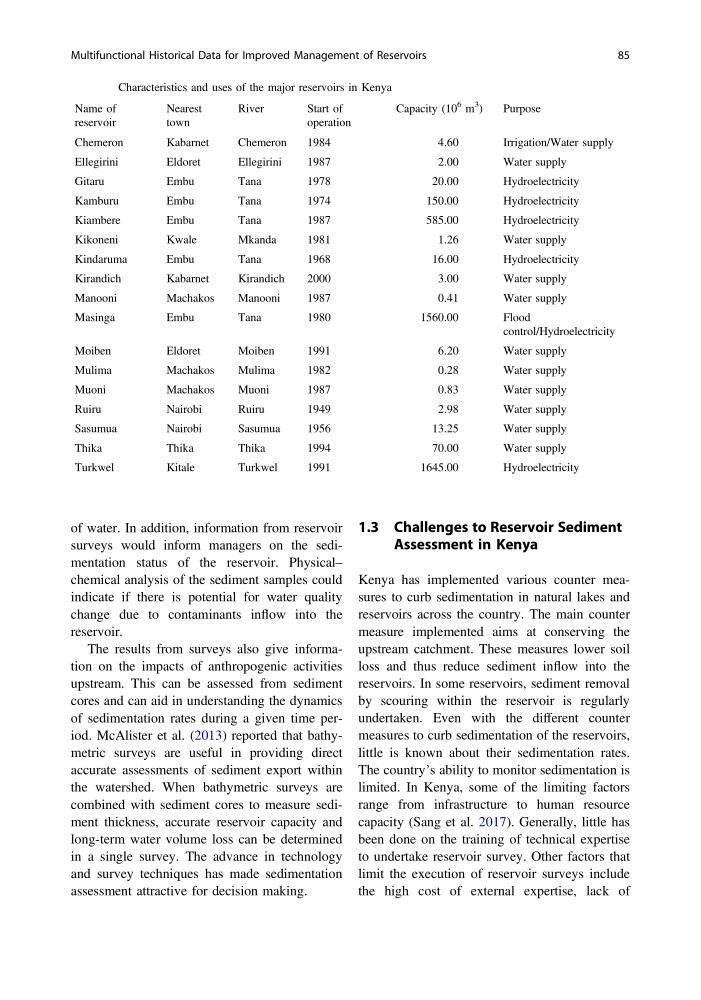
Table 1 Characteristics and uses of the major reservoirs in Kenya
Name of
reservoir
Nearest
town
River
Start of
operation
Capacity (10
6 m
3
)
Purpose
Chemeron
Kabarnet
Chemeron
1984
4.60
Irrigation/Water supply
Ellegirini
Eldoret
Ellegirini
1987
2.00
Water supply
Gitaru
Embu
Tana
1978
20.00
Hydroelectricity
Kamburu
Embu
Tana
1974
150.00
Hydroelectricity
Kiambere
Embu
Tana
1987
585.00
Hydroelectricity
Kikoneni
Kwale
Mkanda
1981
1.26
Water supply
Kindaruma
Embu
Tana
1968
16.00
Hydroelectricity
Kirandich
Kabarnet
Kirandich
2000
3.00
Water supply
Manooni
Machakos
Manooni
1987
0.41
Water supply
Masinga
Embu
Tana
1980
1560.00
Flood
control/Hydroelectricity
Moiben
Eldoret
Moiben
1991
6.20
Water supply
Mulima
Machakos
Mulima
1982
0.28
Water supply
Muoni
Machakos
Muoni
1987
0.83
Water supply
Ruiru
Nairobi
Ruiru
1949
2.98
Water supply
Sasumua
Nairobi
Sasumua
1956
13.25
Water supply
Thika
Thika
Thika
1994
70.00
Water supply
Turkwel
Kitale
Turkwel
1991
1645.00
Hydroelectricity
Multifunctional Historical Data for Improved Management of Reservoirs
85
surveys would inform managers on the sedimentation status of the reservoir. Physical–
chemical analysis of the sediment samples could
indicate if there is potential for water quality
change due to contaminants inflow into the
reservoir.
The results from surveys also give information on the impacts of anthropogenic activities
upstream. This can be assessed from sediment
cores and can aid in understanding the dynamics
of sedimentation rates during a given time period. McAlister et al. (2013) reported that bathymetric surveys are useful in providing direct
accurate assessments of sediment export within
the watershed. When bathymetric surveys are
combined with sediment cores to measure sediment thickness, accurate reservoir capacity and
long-term water volume loss can be determined
in a single survey. The advance in technology
and survey techniques has made sedimentation
assessment attractive for decision making.
1.3 Challenges to Reservoir Sediment
Assessment in Kenya
Kenya has implemented various counter measures to curb sedimentation in natural lakes and
reservoirs across the country. The main counter
measure implemented aims at conserving the
upstream catchment. These measures lower soil
loss and thus reduce sediment inflow into the
reservoirs. In some reservoirs, sediment removal
by scouring within the reservoir is regularly
undertaken. Even with the different counter
measures to curb sedimentation of the reservoirs,
little is known about their sedimentation rates.
The country’s ability to monitor sedimentation is
limited. In Kenya, some of the limiting factors
range from infrastructure to human resource
capacity (Sang et al. 2017). Generally, little has
been done on the training of technical expertise
to undertake reservoir survey. Other factors that
limit the execution of reservoir surveys include
the high cost of external expertise, lack of
Table 1 Characteristics and uses of the major reservoirs in Kenya
Name of
reservoir
Nearest
town
River
Start of
operation
Capacity (10
6 m
3
)
Purpose
Chemeron
Kabarnet
Chemeron
1984
4.60
Irrigation/Water supply
Ellegirini
Eldoret
Ellegirini
1987
2.00
Water supply
Gitaru
Embu
Tana
1978
20.00
Hydroelectricity
Kamburu
Embu
Tana
1974
150.00
Hydroelectricity
Kiambere
Embu
Tana
1987
585.00
Hydroelectricity
Kikoneni
Kwale
Mkanda
1981
1.26
Water supply
Kindaruma
Embu
Tana
1968
16.00
Hydroelectricity
Kirandich
Kabarnet
Kirandich
2000
3.00
Water supply
Manooni
Machakos
Manooni
1987
0.41
Water supply
Masinga
Embu
Tana
1980
1560.00
Flood
control/Hydroelectricity
Moiben
Eldoret
Moiben
1991
6.20
Water supply
Mulima
Machakos
Mulima
1982
0.28
Water supply
Muoni
Machakos
Muoni
1987
0.83
Water supply
Ruiru
Nairobi
Ruiru
1949
2.98
Water supply
Sasumua
Nairobi
Sasumua
1956
13.25
Water supply
Thika
Thika
Thika
1994
70.00
Water supply
Turkwel
Kitale
Turkwel
1991
1645.00
Hydroelectricity
Multifunctional Historical Data for Improved Management of Reservoirs
85