

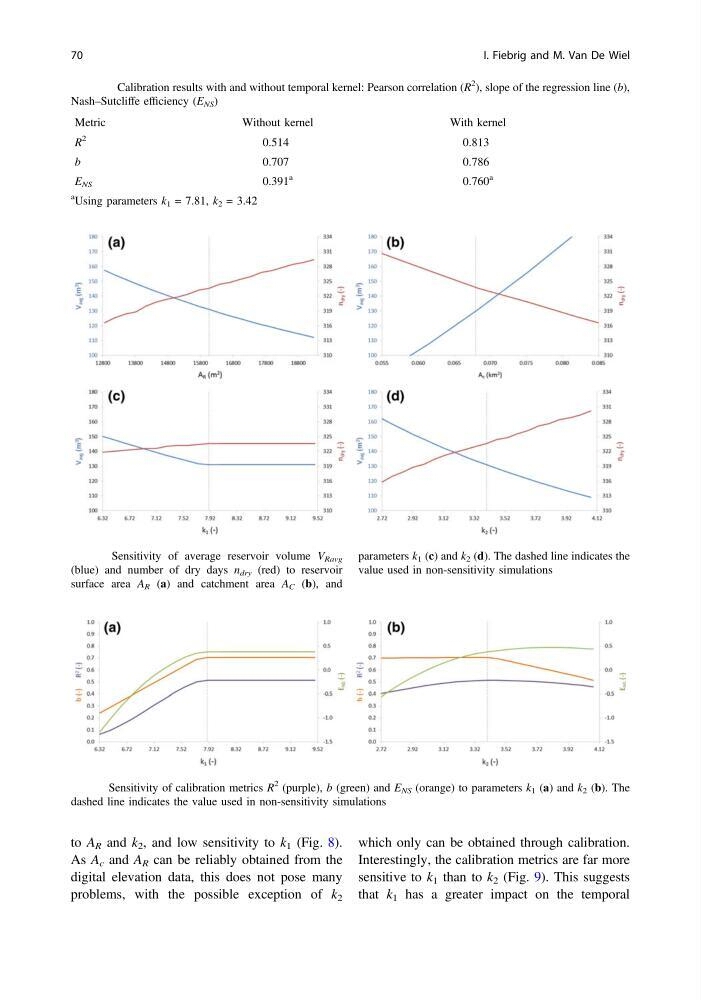
to A R and k 2 , and low sensitivity to k 1 (Fig. 8).
As A c and A R can be reliably obtained from the
digital elevation data, this does not pose many
problems, with the possible exception of k 2
which only can be obtained through calibration.
Interestingly, the calibration metrics are far more
sensitive to k 1 than to k 2 (Fig. 9). This suggests
that k 1 has a greater impact on the temporal
Table 6 Calibration results with and without temporal kernel: Pearson correlation (R
2
), slope of the regression line (b),
Nash–Sutcliffe efficiency (E NS )
Metric
Without kernel
With kernel
R
2
0.514
0.813
b
0.707
0.786
E NS
0.391
a
0.760
a
a Using parameters k 1 = 7.81, k 2 = 3.42
Fig. 8 Sensitivity of average reservoir volume V Ravg
(blue) and number of dry days n dry (red) to reservoir
surface area A R (a) and catchment area A C (b), and
parameters k 1 (c) and k 2 (d). The dashed line indicates the
value used in non-sensitivity simulations
Fig. 9 Sensitivity of calibration metrics R
2 (purple), b (green) and E NS (orange) to parameters k 1 (a) and k 2 (b). The
dashed line indicates the value used in non-sensitivity simulations
70
I. Fiebrig and M. Van De Wiel
As A c and A R can be reliably obtained from the
digital elevation data, this does not pose many
problems, with the possible exception of k 2
which only can be obtained through calibration.
Interestingly, the calibration metrics are far more
sensitive to k 1 than to k 2 (Fig. 9). This suggests
that k 1 has a greater impact on the temporal
Table 6 Calibration results with and without temporal kernel: Pearson correlation (R
2
), slope of the regression line (b),
Nash–Sutcliffe efficiency (E NS )
Metric
Without kernel
With kernel
R
2
0.514
0.813
b
0.707
0.786
E NS
0.391
a
0.760
a
a Using parameters k 1 = 7.81, k 2 = 3.42
Fig. 8 Sensitivity of average reservoir volume V Ravg
(blue) and number of dry days n dry (red) to reservoir
surface area A R (a) and catchment area A C (b), and
parameters k 1 (c) and k 2 (d). The dashed line indicates the
value used in non-sensitivity simulations
Fig. 9 Sensitivity of calibration metrics R
2 (purple), b (green) and E NS (orange) to parameters k 1 (a) and k 2 (b). The
dashed line indicates the value used in non-sensitivity simulations
70
I. Fiebrig and M. Van De Wiel