

to reduce the rate of carbon accumulation.
A particularly large share (over 50%) of soils
with very high or high acidification characterized by agricultural land in Masovian,
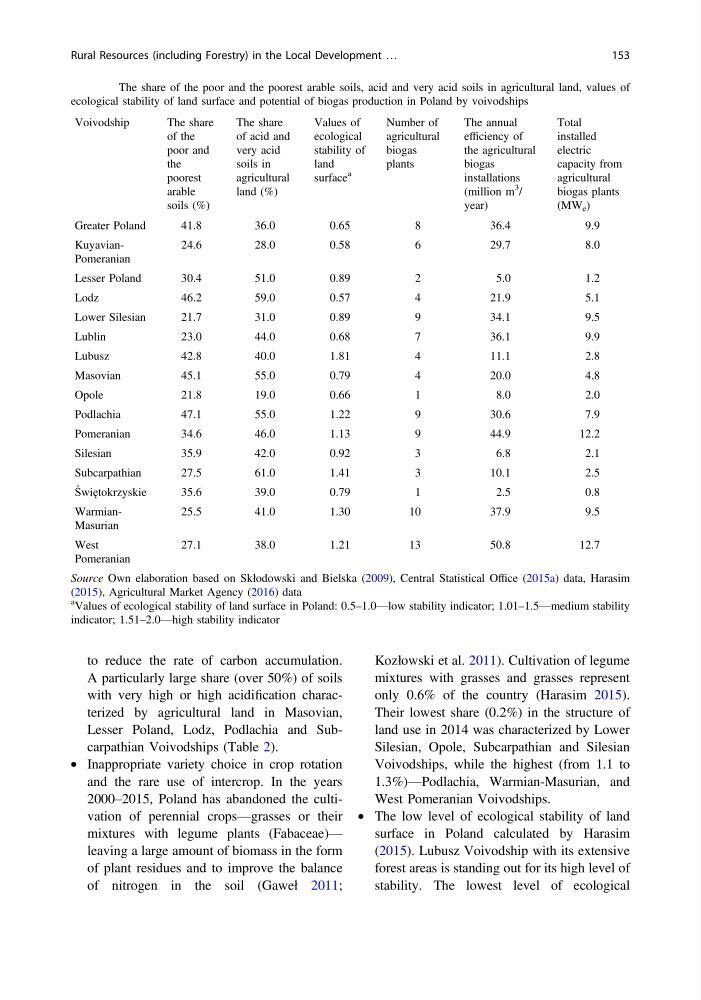
Lesser Poland, Lodz, Podlachia and Subcarpathian Voivodships (Table 2).
• Inappropriate variety choice in crop rotation
and the rare use of intercrop. In the years
2000‒2015, Poland has abandoned the cultivation of perennial crops—grasses or their
mixtures with legume plants (Fabaceae)—
leaving a large amount of biomass in the form
of plant residues and to improve the balance
of nitrogen in the soil (Gaweł 2011;
Kozłowski et al. 2011). Cultivation of legume
mixtures with grasses and grasses represent
only 0.6% of the country (Harasim 2015).
Their lowest share (0.2%) in the structure of
land use in 2014 was characterized by Lower
Silesian, Opole, Subcarpathian and Silesian
Voivodships, while the highest (from 1.1 to
1.3%)—Podlachia, Warmian-Masurian, and
West Pomeranian Voivodships.
• The low level of ecological stability of land
surface in Poland calculated by Harasim
(2015). Lubusz Voivodship with its extensive
forest areas is standing out for its high level of
stability. The lowest level of ecological
Table 2 The share of the poor and the poorest arable soils, acid and very acid soils in agricultural land, values of
ecological stability of land surface and potential of biogas production in Poland by voivodships
Voivodship
The share
of the
poor and
the
poorest
arable
soils (%)
The share
of acid and
very acid
soils in
agricultural
land (%)
Values of
ecological
stability of
land
surface
a
Number of
agricultural
biogas
plants
The annual
efficiency of
the agricultural
biogas
installations
(million m
3
/
year)
Total
installed
electric
capacity from
agricultural
biogas plants
(MW e )
Greater Poland
41.8
36.0
0.65
8
36.4
9.9
KuyavianPomeranian
24.6
28.0
0.58
6
29.7
8.0
Lesser Poland
30.4
51.0
0.89
2
5.0
1.2
Lodz
46.2
59.0
0.57
4
21.9
5.1
Lower Silesian
21.7
31.0
0.89
9
34.1
9.5
Lublin
23.0
44.0
0.68
7
36.1
9.9
Lubusz
42.8
40.0
1.81
4
11.1
2.8
Masovian
45.1
55.0
0.79
4
20.0
4.8
Opole
21.8
19.0
0.66
1
8.0
2.0
Podlachia
47.1
55.0
1.22
9
30.6
7.9
Pomeranian
34.6
46.0
1.13
9
44.9
12.2
Silesian
35.9
42.0
0.92
3
6.8
2.1
Subcarpathian
27.5
61.0
1.41
3
10.1
2.5
Świętokrzyskie
35.6
39.0
0.79
1
2.5
0.8
WarmianMasurian
25.5
41.0
1.30
10
37.9
9.5
West
Pomeranian
27.1
38.0
1.21
13
50.8
12.7
Source Own elaboration based on Skłodowski and Bielska (2009), Central Statistical Office (2015a) data, Harasim
(2015), Agricultural Market Agency (2016) data
a Values of ecological stability of land surface in Poland: 0.5–1.0—low stability indicator; 1.01–1.5—medium stability
indicator; 1.51–2.0—high stability indicator
Rural Resources (including Forestry) in the Local Development …
153
A particularly large share (over 50%) of soils
with very high or high acidification characterized by agricultural land in Masovian,
Lesser Poland, Lodz, Podlachia and Subcarpathian Voivodships (Table 2).
• Inappropriate variety choice in crop rotation
and the rare use of intercrop. In the years
2000‒2015, Poland has abandoned the cultivation of perennial crops—grasses or their
mixtures with legume plants (Fabaceae)—
leaving a large amount of biomass in the form
of plant residues and to improve the balance
of nitrogen in the soil (Gaweł 2011;
Kozłowski et al. 2011). Cultivation of legume
mixtures with grasses and grasses represent
only 0.6% of the country (Harasim 2015).
Their lowest share (0.2%) in the structure of
land use in 2014 was characterized by Lower
Silesian, Opole, Subcarpathian and Silesian
Voivodships, while the highest (from 1.1 to
1.3%)—Podlachia, Warmian-Masurian, and
West Pomeranian Voivodships.
• The low level of ecological stability of land
surface in Poland calculated by Harasim
(2015). Lubusz Voivodship with its extensive
forest areas is standing out for its high level of
stability. The lowest level of ecological
Table 2 The share of the poor and the poorest arable soils, acid and very acid soils in agricultural land, values of
ecological stability of land surface and potential of biogas production in Poland by voivodships
Voivodship
The share
of the
poor and
the
poorest
arable
soils (%)
The share
of acid and
very acid
soils in
agricultural
land (%)
Values of
ecological
stability of
land
surface
a
Number of
agricultural
biogas
plants
The annual
efficiency of
the agricultural
biogas
installations
(million m
3
/
year)
Total
installed
electric
capacity from
agricultural
biogas plants
(MW e )
Greater Poland
41.8
36.0
0.65
8
36.4
9.9
KuyavianPomeranian
24.6
28.0
0.58
6
29.7
8.0
Lesser Poland
30.4
51.0
0.89
2
5.0
1.2
Lodz
46.2
59.0
0.57
4
21.9
5.1
Lower Silesian
21.7
31.0
0.89
9
34.1
9.5
Lublin
23.0
44.0
0.68
7
36.1
9.9
Lubusz
42.8
40.0
1.81
4
11.1
2.8
Masovian
45.1
55.0
0.79
4
20.0
4.8
Opole
21.8
19.0
0.66
1
8.0
2.0
Podlachia
47.1
55.0
1.22
9
30.6
7.9
Pomeranian
34.6
46.0
1.13
9
44.9
12.2
Silesian
35.9
42.0
0.92
3
6.8
2.1
Subcarpathian
27.5
61.0
1.41
3
10.1
2.5
Świętokrzyskie
35.6
39.0
0.79
1
2.5
0.8
WarmianMasurian
25.5
41.0
1.30
10
37.9
9.5
West
Pomeranian
27.1
38.0
1.21
13
50.8
12.7
Source Own elaboration based on Skłodowski and Bielska (2009), Central Statistical Office (2015a) data, Harasim
(2015), Agricultural Market Agency (2016) data
a Values of ecological stability of land surface in Poland: 0.5–1.0—low stability indicator; 1.01–1.5—medium stability
indicator; 1.51–2.0—high stability indicator
Rural Resources (including Forestry) in the Local Development …
153