

in 2015, farmers pay 110 rials/kWh on average,
which is much less than the provision price of
800 rials/kWh (Chitchian 2015b, Ministry
announcement on 27.2.2015). In the same year,
the average price of electricity for export was
8–11 cents per kWh (Mahsuli 2014, Ministry
Deputy announcement on 15.11.2014). Based on
Iran’s 2014 Energy Balance Sheet, the average
price of energy for domestic use in 2014 was
346.7 rials/kWh and 442.6 rials/kWh for industrial use. The average official USD-Iranian rials
(IRR) exchange rate in 2014 was 32,800 IRR =
1 USD (according to the Central Bank of the
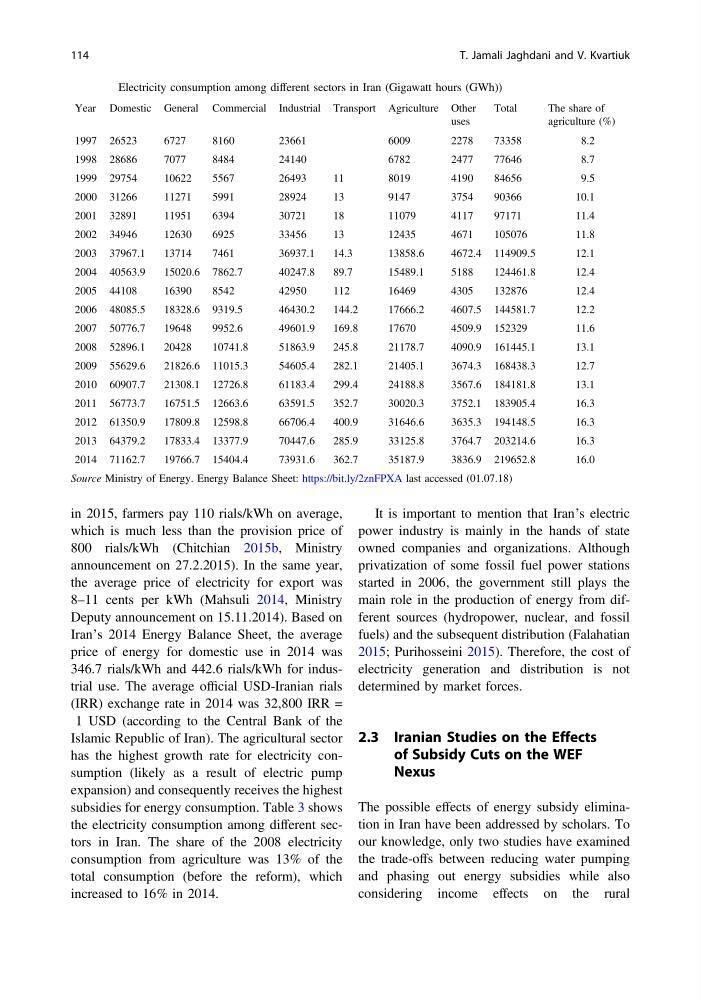
Islamic Republic of Iran). The agricultural sector
has the highest growth rate for electricity consumption (likely as a result of electric pump
expansion) and consequently receives the highest
subsidies for energy consumption. Table 3 shows
the electricity consumption among different sectors in Iran. The share of the 2008 electricity
consumption from agriculture was 13% of the
total consumption (before the reform), which
increased to 16% in 2014.
It is important to mention that Iran’s electric
power industry is mainly in the hands of state
owned companies and organizations. Although
privatization of some fossil fuel power stations
started in 2006, the government still plays the
main role in the production of energy from different sources (hydropower, nuclear, and fossil
fuels) and the subsequent distribution (Falahatian
2015; Purihosseini 2015). Therefore, the cost of
electricity generation and distribution is not
determined by market forces.
2.3 Iranian Studies on the Effects
of Subsidy Cuts on the WEF
Nexus
The possible effects of energy subsidy elimination in Iran have been addressed by scholars. To
our knowledge, only two studies have examined
the trade-offs between reducing water pumping
and phasing out energy subsidies while also
considering income effects on the rural
Table 3 Electricity consumption among different sectors in Iran (Gigawatt hours (GWh))
Year Domestic General Commercial Industrial Transport Agriculture Other
uses
Total
The share of
agriculture (%)
1997 26523
6727
8160
23661
6009
2278
73358
8.2
1998 28686
7077
8484
24140
6782
2477
77646
8.7
1999 29754
10622
5567
26493
11
8019
4190
84656
9.5
2000 31266
11271
5991
28924
13
9147
3754
90366
10.1
2001 32891
11951
6394
30721
18
11079
4117
97171
11.4
2002 34946
12630
6925
33456
13
12435
4671
105076
11.8
2003 37967.1
13714
7461
36937.1
14.3
13858.6
4672.4 114909.5
12.1
2004 40563.9
15020.6 7862.7
40247.8
89.7
15489.1
5188
124461.8
12.4
2005 44108
16390
8542
42950
112
16469
4305
132876
12.4
2006 48085.5
18328.6 9319.5
46430.2
144.2
17666.2
4607.5 144581.7
12.2
2007 50776.7
19648
9952.6
49601.9
169.8
17670
4509.9 152329
11.6
2008 52896.1
20428
10741.8
51863.9
245.8
21178.7
4090.9 161445.1
13.1
2009 55629.6
21826.6 11015.3
54605.4
282.1
21405.1
3674.3 168438.3
12.7
2010 60907.7
21308.1 12726.8
61183.4
299.4
24188.8
3567.6 184181.8
13.1
2011 56773.7
16751.5 12663.6
63591.5
352.7
30020.3
3752.1 183905.4
16.3
2012 61350.9
17809.8 12598.8
66706.4
400.9
31646.6
3635.3 194148.5
16.3
2013 64379.2
17833.4 13377.9
70447.6
285.9
33125.8
3764.7 203214.6
16.3
2014 71162.7
19766.7 15404.4
73931.6
362.7
35187.9
3836.9 219652.8
16.0
Source Ministry of Energy. Energy Balance Sheet: https://bit.ly/2znFPXA last accessed (01.07.18)
114
T. Jamali Jaghdani and V. Kvartiuk
which is much less than the provision price of
800 rials/kWh (Chitchian 2015b, Ministry
announcement on 27.2.2015). In the same year,
the average price of electricity for export was
8–11 cents per kWh (Mahsuli 2014, Ministry
Deputy announcement on 15.11.2014). Based on
Iran’s 2014 Energy Balance Sheet, the average
price of energy for domestic use in 2014 was
346.7 rials/kWh and 442.6 rials/kWh for industrial use. The average official USD-Iranian rials
(IRR) exchange rate in 2014 was 32,800 IRR =
1 USD (according to the Central Bank of the
Islamic Republic of Iran). The agricultural sector
has the highest growth rate for electricity consumption (likely as a result of electric pump
expansion) and consequently receives the highest
subsidies for energy consumption. Table 3 shows
the electricity consumption among different sectors in Iran. The share of the 2008 electricity
consumption from agriculture was 13% of the
total consumption (before the reform), which
increased to 16% in 2014.
It is important to mention that Iran’s electric
power industry is mainly in the hands of state
owned companies and organizations. Although
privatization of some fossil fuel power stations
started in 2006, the government still plays the
main role in the production of energy from different sources (hydropower, nuclear, and fossil
fuels) and the subsequent distribution (Falahatian
2015; Purihosseini 2015). Therefore, the cost of
electricity generation and distribution is not
determined by market forces.
2.3 Iranian Studies on the Effects
of Subsidy Cuts on the WEF
Nexus
The possible effects of energy subsidy elimination in Iran have been addressed by scholars. To
our knowledge, only two studies have examined
the trade-offs between reducing water pumping
and phasing out energy subsidies while also
considering income effects on the rural
Table 3 Electricity consumption among different sectors in Iran (Gigawatt hours (GWh))
Year Domestic General Commercial Industrial Transport Agriculture Other
uses
Total
The share of
agriculture (%)
1997 26523
6727
8160
23661
6009
2278
73358
8.2
1998 28686
7077
8484
24140
6782
2477
77646
8.7
1999 29754
10622
5567
26493
11
8019
4190
84656
9.5
2000 31266
11271
5991
28924
13
9147
3754
90366
10.1
2001 32891
11951
6394
30721
18
11079
4117
97171
11.4
2002 34946
12630
6925
33456
13
12435
4671
105076
11.8
2003 37967.1
13714
7461
36937.1
14.3
13858.6
4672.4 114909.5
12.1
2004 40563.9
15020.6 7862.7
40247.8
89.7
15489.1
5188
124461.8
12.4
2005 44108
16390
8542
42950
112
16469
4305
132876
12.4
2006 48085.5
18328.6 9319.5
46430.2
144.2
17666.2
4607.5 144581.7
12.2
2007 50776.7
19648
9952.6
49601.9
169.8
17670
4509.9 152329
11.6
2008 52896.1
20428
10741.8
51863.9
245.8
21178.7
4090.9 161445.1
13.1
2009 55629.6
21826.6 11015.3
54605.4
282.1
21405.1
3674.3 168438.3
12.7
2010 60907.7
21308.1 12726.8
61183.4
299.4
24188.8
3567.6 184181.8
13.1
2011 56773.7
16751.5 12663.6
63591.5
352.7
30020.3
3752.1 183905.4
16.3
2012 61350.9
17809.8 12598.8
66706.4
400.9
31646.6
3635.3 194148.5
16.3
2013 64379.2
17833.4 13377.9
70447.6
285.9
33125.8
3764.7 203214.6
16.3
2014 71162.7
19766.7 15404.4
73931.6
362.7
35187.9
3836.9 219652.8
16.0
Source Ministry of Energy. Energy Balance Sheet: https://bit.ly/2znFPXA last accessed (01.07.18)
114
T. Jamali Jaghdani and V. Kvartiuk