

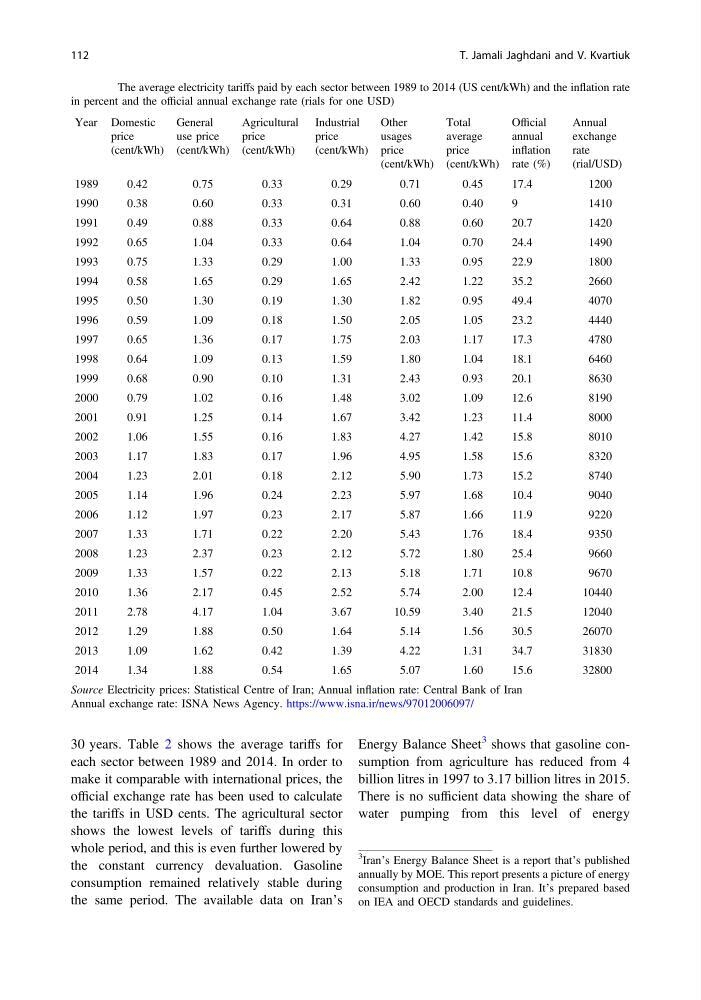
30 years. Table 2 shows the average tariffs for
each sector between 1989 and 2014. In order to
make it comparable with international prices, the
official exchange rate has been used to calculate
the tariffs in USD cents. The agricultural sector
shows the lowest levels of tariffs during this
whole period, and this is even further lowered by
the constant currency devaluation. Gasoline
consumption remained relatively stable during
the same period. The available data on Iran’s
Energy Balance Sheet
3 shows that gasoline consumption from agriculture has reduced from 4
billion litres in 1997 to 3.17 billion litres in 2015.
There is no sufficient data showing the share of
water pumping from this level of energy
Table 2 The average electricity tariffs paid by each sector between 1989 to 2014 (US cent/kWh) and the inflation rate
in percent and the official annual exchange rate (rials for one USD)
Year Domestic
price
(cent/kWh)
General
use price
(cent/kWh)
Agricultural
price
(cent/kWh)
Industrial
price
(cent/kWh)
Other
usages
price
(cent/kWh)
Total
average
price
(cent/kWh)
Official
annual
inflation
rate (%)
Annual
exchange
rate
(rial/USD)
1989
0.42
0.75
0.33
0.29
0.71
0.45
17.4
1200
1990
0.38
0.60
0.33
0.31
0.60
0.40
9
1410
1991
0.49
0.88
0.33
0.64
0.88
0.60
20.7
1420
1992
0.65
1.04
0.33
0.64
1.04
0.70
24.4
1490
1993
0.75
1.33
0.29
1.00
1.33
0.95
22.9
1800
1994
0.58
1.65
0.29
1.65
2.42
1.22
35.2
2660
1995
0.50
1.30
0.19
1.30
1.82
0.95
49.4
4070
1996
0.59
1.09
0.18
1.50
2.05
1.05
23.2
4440
1997
0.65
1.36
0.17
1.75
2.03
1.17
17.3
4780
1998
0.64
1.09
0.13
1.59
1.80
1.04
18.1
6460
1999
0.68
0.90
0.10
1.31
2.43
0.93
20.1
8630
2000
0.79
1.02
0.16
1.48
3.02
1.09
12.6
8190
2001
0.91
1.25
0.14
1.67
3.42
1.23
11.4
8000
2002
1.06
1.55
0.16
1.83
4.27
1.42
15.8
8010
2003
1.17
1.83
0.17
1.96
4.95
1.58
15.6
8320
2004
1.23
2.01
0.18
2.12
5.90
1.73
15.2
8740
2005
1.14
1.96
0.24
2.23
5.97
1.68
10.4
9040
2006
1.12
1.97
0.23
2.17
5.87
1.66
11.9
9220
2007
1.33
1.71
0.22
2.20
5.43
1.76
18.4
9350
2008
1.23
2.37
0.23
2.12
5.72
1.80
25.4
9660
2009
1.33
1.57
0.22
2.13
5.18
1.71
10.8
9670
2010
1.36
2.17
0.45
2.52
5.74
2.00
12.4
10440
2011
2.78
4.17
1.04
3.67
10.59
3.40
21.5
12040
2012
1.29
1.88
0.50
1.64
5.14
1.56
30.5
26070
2013
1.09
1.62
0.42
1.39
4.22
1.31
34.7
31830
2014
1.34
1.88
0.54
1.65
5.07
1.60
15.6
32800
Source Electricity prices: Statistical Centre of Iran; Annual inflation rate: Central Bank of Iran
Annual exchange rate: ISNA News Agency. https://www.isna.ir/news/97012006097/
3
Iran’s Energy Balance Sheet is a report that’s published
annually by MOE. This report presents a picture of energy
consumption and production in Iran. It’s prepared based
on IEA and OECD standards and guidelines.
112
T. Jamali Jaghdani and V. Kvartiuk
each sector between 1989 and 2014. In order to
make it comparable with international prices, the
official exchange rate has been used to calculate
the tariffs in USD cents. The agricultural sector
shows the lowest levels of tariffs during this
whole period, and this is even further lowered by
the constant currency devaluation. Gasoline
consumption remained relatively stable during
the same period. The available data on Iran’s
Energy Balance Sheet
3 shows that gasoline consumption from agriculture has reduced from 4
billion litres in 1997 to 3.17 billion litres in 2015.
There is no sufficient data showing the share of
water pumping from this level of energy
Table 2 The average electricity tariffs paid by each sector between 1989 to 2014 (US cent/kWh) and the inflation rate
in percent and the official annual exchange rate (rials for one USD)
Year Domestic
price
(cent/kWh)
General
use price
(cent/kWh)
Agricultural
price
(cent/kWh)
Industrial
price
(cent/kWh)
Other
usages
price
(cent/kWh)
Total
average
price
(cent/kWh)
Official
annual
inflation
rate (%)
Annual
exchange
rate
(rial/USD)
1989
0.42
0.75
0.33
0.29
0.71
0.45
17.4
1200
1990
0.38
0.60
0.33
0.31
0.60
0.40
9
1410
1991
0.49
0.88
0.33
0.64
0.88
0.60
20.7
1420
1992
0.65
1.04
0.33
0.64
1.04
0.70
24.4
1490
1993
0.75
1.33
0.29
1.00
1.33
0.95
22.9
1800
1994
0.58
1.65
0.29
1.65
2.42
1.22
35.2
2660
1995
0.50
1.30
0.19
1.30
1.82
0.95
49.4
4070
1996
0.59
1.09
0.18
1.50
2.05
1.05
23.2
4440
1997
0.65
1.36
0.17
1.75
2.03
1.17
17.3
4780
1998
0.64
1.09
0.13
1.59
1.80
1.04
18.1
6460
1999
0.68
0.90
0.10
1.31
2.43
0.93
20.1
8630
2000
0.79
1.02
0.16
1.48
3.02
1.09
12.6
8190
2001
0.91
1.25
0.14
1.67
3.42
1.23
11.4
8000
2002
1.06
1.55
0.16
1.83
4.27
1.42
15.8
8010
2003
1.17
1.83
0.17
1.96
4.95
1.58
15.6
8320
2004
1.23
2.01
0.18
2.12
5.90
1.73
15.2
8740
2005
1.14
1.96
0.24
2.23
5.97
1.68
10.4
9040
2006
1.12
1.97
0.23
2.17
5.87
1.66
11.9
9220
2007
1.33
1.71
0.22
2.20
5.43
1.76
18.4
9350
2008
1.23
2.37
0.23
2.12
5.72
1.80
25.4
9660
2009
1.33
1.57
0.22
2.13
5.18
1.71
10.8
9670
2010
1.36
2.17
0.45
2.52
5.74
2.00
12.4
10440
2011
2.78
4.17
1.04
3.67
10.59
3.40
21.5
12040
2012
1.29
1.88
0.50
1.64
5.14
1.56
30.5
26070
2013
1.09
1.62
0.42
1.39
4.22
1.31
34.7
31830
2014
1.34
1.88
0.54
1.65
5.07
1.60
15.6
32800
Source Electricity prices: Statistical Centre of Iran; Annual inflation rate: Central Bank of Iran
Annual exchange rate: ISNA News Agency. https://www.isna.ir/news/97012006097/
3
Iran’s Energy Balance Sheet is a report that’s published
annually by MOE. This report presents a picture of energy
consumption and production in Iran. It’s prepared based
on IEA and OECD standards and guidelines.
112
T. Jamali Jaghdani and V. Kvartiuk