

24
an internal dose is associated with the amount of radioactive material, which entered
the body, where it goes in the body, how long it stays in the body and the type of
radiation it emits.
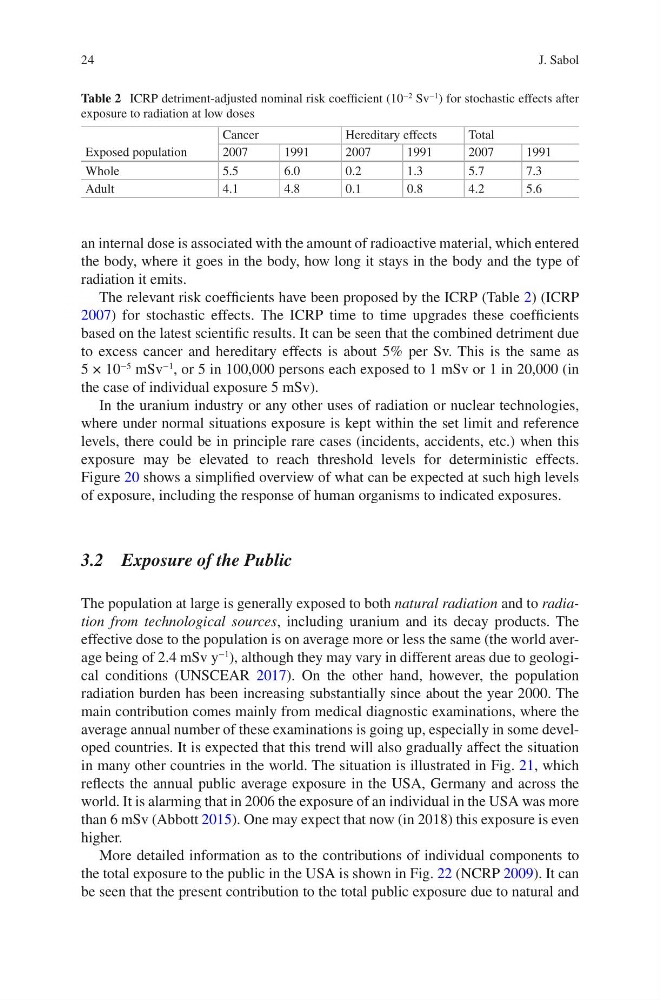
The relevant risk coefficients have been proposed by the ICRP (Table 2) (ICRP
2007) for stochastic effects. The ICRP time to time upgrades these coefficients
based on the latest scientific results. It can be seen that the combined detriment due
to excess cancer and hereditary effects is about 5% per Sv. This is the same as
5 × 10
−5
mSv
−1
, or 5 in 100,000 persons each exposed to 1 mSv or 1 in 20,000 (in
the case of individual exposure 5 mSv).
In the uranium industry or any other uses of radiation or nuclear technologies,
where under normal situations exposure is kept within the set limit and reference
levels, there could be in principle rare cases (incidents, accidents, etc.) when this
exposure may be elevated to reach threshold levels for deterministic effects.
Figure 20 shows a simplified overview of what can be expected at such high levels
of exposure, including the response of human organisms to indicated exposures.
3.2 Exposure of the Public
The population at large is generally exposed to both natural radiation and to radiation from technological sources, including uranium and its decay products. The
effective dose to the population is on average more or less the same (the world average being of 2.4 mSv y
−1
), although they may vary in different areas due to geological conditions (UNSCEAR 2017). On the other hand, however, the population
radiation burden has been increasing substantially since about the year 2000. The
main contribution comes mainly from medical diagnostic examinations, where the
average annual number of these examinations is going up, especially in some developed countries. It is expected that this trend will also gradually affect the situation
in many other countries in the world. The situation is illustrated in Fig. 21, which
reflects the annual public average exposure in the USA, Germany and across the
world. It is alarming that in 2006 the exposure of an individual in the USA was more
than 6 mSv (Abbott 2015). One may expect that now (in 2018) this exposure is even
higher.
More detailed information as to the contributions of individual components to
the total exposure to the public in the USA is shown in Fig. 22 (NCRP 2009). It can
be seen that the present contribution to the total public exposure due to natural and
Table 2 ICRP detriment-adjusted nominal risk coefficient (10
−2
Sv
−1
) for stochastic effects after
exposure to radiation at low doses
Exposed population
Cancer
Hereditary effects
Total
2007
1991
2007
1991
2007
1991
Whole
5.5
6.0
0.2
1.3
5.7
7.3
Adult
4.1
4.8
0.1
0.8
4.2
5.6
J. Sabol
an internal dose is associated with the amount of radioactive material, which entered
the body, where it goes in the body, how long it stays in the body and the type of
radiation it emits.
The relevant risk coefficients have been proposed by the ICRP (Table 2) (ICRP
2007) for stochastic effects. The ICRP time to time upgrades these coefficients
based on the latest scientific results. It can be seen that the combined detriment due
to excess cancer and hereditary effects is about 5% per Sv. This is the same as
5 × 10
−5
mSv
−1
, or 5 in 100,000 persons each exposed to 1 mSv or 1 in 20,000 (in
the case of individual exposure 5 mSv).
In the uranium industry or any other uses of radiation or nuclear technologies,
where under normal situations exposure is kept within the set limit and reference
levels, there could be in principle rare cases (incidents, accidents, etc.) when this
exposure may be elevated to reach threshold levels for deterministic effects.
Figure 20 shows a simplified overview of what can be expected at such high levels
of exposure, including the response of human organisms to indicated exposures.
3.2 Exposure of the Public
The population at large is generally exposed to both natural radiation and to radiation from technological sources, including uranium and its decay products. The
effective dose to the population is on average more or less the same (the world average being of 2.4 mSv y
−1
), although they may vary in different areas due to geological conditions (UNSCEAR 2017). On the other hand, however, the population
radiation burden has been increasing substantially since about the year 2000. The
main contribution comes mainly from medical diagnostic examinations, where the
average annual number of these examinations is going up, especially in some developed countries. It is expected that this trend will also gradually affect the situation
in many other countries in the world. The situation is illustrated in Fig. 21, which
reflects the annual public average exposure in the USA, Germany and across the
world. It is alarming that in 2006 the exposure of an individual in the USA was more
than 6 mSv (Abbott 2015). One may expect that now (in 2018) this exposure is even
higher.
More detailed information as to the contributions of individual components to
the total exposure to the public in the USA is shown in Fig. 22 (NCRP 2009). It can
be seen that the present contribution to the total public exposure due to natural and
Table 2 ICRP detriment-adjusted nominal risk coefficient (10
−2
Sv
−1
) for stochastic effects after
exposure to radiation at low doses
Exposed population
Cancer
Hereditary effects
Total
2007
1991
2007
1991
2007
1991
Whole
5.5
6.0
0.2
1.3
5.7
7.3
Adult
4.1
4.8
0.1
0.8
4.2
5.6
J. Sabol