

199
2.4 Transfers of Uranium to Terrestrial Animals
Both the IAEA (2010) and Thorne (2003) have reviewed transfer factors between
the diet of animals and various food products. These transfer factors are ratios of the
concentration in the food product for chronic exposure to the rate of intake in the
diet. Transfer factors to milk are generally 2 10
−3
d L
−1
or lower, and transfer factors
to beef are less than 1 10
−3
d kg
−1
. Values for pork are typically rather larger (between
1 10
−3
and 1 10
−2
d kg
−1
). For poultry meat and eggs values of about 1 d kg
−1
are
recorded. These results are broadly as would be expected if uranium uptake and
retention is independent of the mass of the animal, because this results in transfer
factors that vary in inverse proportion to body mass.
Thorne (2003) also analysed kinetic data on the retention of uranium in animals
and demonstrated that these data are broadly consistent with the transfer factors
given above, except that gastrointestinal absorption may be enhanced in poultry
compared with the other types of animal studied.
The IAEA (2014) has provided concentration ratios for wildlife relative to the
environmental media that comprise their habitats. These data are set out in Table 3.
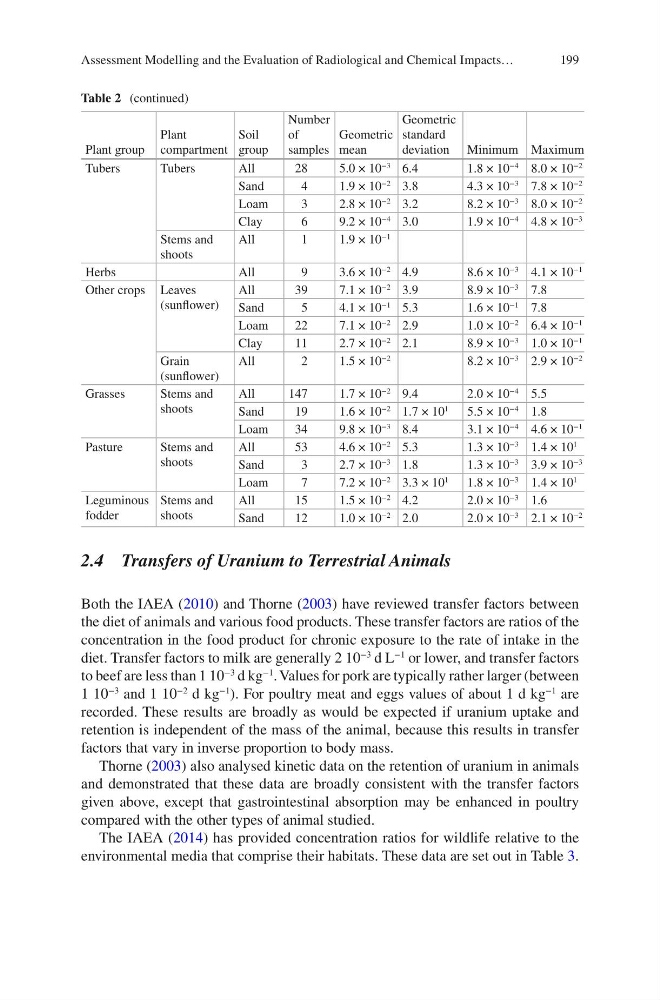
Table 2 (continued)
Plant group
Plant
compartment
Soil
group
Number
of
samples
Geometric
mean
Geometric
standard
deviation Minimum Maximum
Tubers
Tubers
All
28
5.0 × 10
−3
6.4
1.8 × 10
−4
8.0 × 10
−2
Sand
4
1.9 × 10
−2
3.8
4.3 × 10
−3
7.8 × 10
−2
Loam
3
2.8 × 10
−2
3.2
8.2 × 10
−3
8.0 × 10
−2
Clay
6
9.2 × 10
−4
3.0
1.9 × 10
−4
4.8 × 10
−3
Stems and
shoots
All
1
1.9 × 10
−1
Herbs
All
9
3.6 × 10
−2
4.9
8.6 × 10
−3
4.1 × 10
−1
Other crops Leaves
(sunflower)
All
39
7.1 × 10
−2
3.9
8.9 × 10
−3
7.8
Sand
5
4.1 × 10
−1
5.3
1.6 × 10
−1
7.8
Loam
22
7.1 × 10
−2
2.9
1.0 × 10
−2
6.4 × 10
−1
Clay
11
2.7 × 10
−2
2.1
8.9 × 10
−3
1.0 × 10
−1
Grain
(sunflower)
All
2
1.5 × 10
−2
8.2 × 10
−3
2.9 × 10
−2
Grasses
Stems and
shoots
All
147
1.7 × 10
−2
9.4
2.0 × 10
−4
5.5
Sand
19
1.6 × 10
−2
1.7 × 10
1
5.5 × 10
−4
1.8
Loam
34
9.8 × 10
−3
8.4
3.1 × 10
−4
4.6 × 10
−1
Pasture
Stems and
shoots
All
53
4.6 × 10
−2
5.3
1.3 × 10
−3
1.4 × 10
1
Sand
3
2.7 × 10
−3
1.8
1.3 × 10
−3
3.9 × 10
−3
Loam
7
7.2 × 10
−2
3.3 × 10
1
1.8 × 10
−3
1.4 × 10
1
Leguminous
fodder
Stems and
shoots
All
15
1.5 × 10
−2
4.2
2.0 × 10
−3
1.6
Sand
12
1.0 × 10
−2
2.0
2.0 × 10
−3
2.1 × 10
−2
Assessment Modelling and the Evaluation of Radiological and Chemical Impacts…
2.4 Transfers of Uranium to Terrestrial Animals
Both the IAEA (2010) and Thorne (2003) have reviewed transfer factors between
the diet of animals and various food products. These transfer factors are ratios of the
concentration in the food product for chronic exposure to the rate of intake in the
diet. Transfer factors to milk are generally 2 10
−3
d L
−1
or lower, and transfer factors
to beef are less than 1 10
−3
d kg
−1
. Values for pork are typically rather larger (between
1 10
−3
and 1 10
−2
d kg
−1
). For poultry meat and eggs values of about 1 d kg
−1
are
recorded. These results are broadly as would be expected if uranium uptake and
retention is independent of the mass of the animal, because this results in transfer
factors that vary in inverse proportion to body mass.
Thorne (2003) also analysed kinetic data on the retention of uranium in animals
and demonstrated that these data are broadly consistent with the transfer factors
given above, except that gastrointestinal absorption may be enhanced in poultry
compared with the other types of animal studied.
The IAEA (2014) has provided concentration ratios for wildlife relative to the
environmental media that comprise their habitats. These data are set out in Table 3.
Table 2 (continued)
Plant group
Plant
compartment
Soil
group
Number
of
samples
Geometric
mean
Geometric
standard
deviation Minimum Maximum
Tubers
Tubers
All
28
5.0 × 10
−3
6.4
1.8 × 10
−4
8.0 × 10
−2
Sand
4
1.9 × 10
−2
3.8
4.3 × 10
−3
7.8 × 10
−2
Loam
3
2.8 × 10
−2
3.2
8.2 × 10
−3
8.0 × 10
−2
Clay
6
9.2 × 10
−4
3.0
1.9 × 10
−4
4.8 × 10
−3
Stems and
shoots
All
1
1.9 × 10
−1
Herbs
All
9
3.6 × 10
−2
4.9
8.6 × 10
−3
4.1 × 10
−1
Other crops Leaves
(sunflower)
All
39
7.1 × 10
−2
3.9
8.9 × 10
−3
7.8
Sand
5
4.1 × 10
−1
5.3
1.6 × 10
−1
7.8
Loam
22
7.1 × 10
−2
2.9
1.0 × 10
−2
6.4 × 10
−1
Clay
11
2.7 × 10
−2
2.1
8.9 × 10
−3
1.0 × 10
−1
Grain
(sunflower)
All
2
1.5 × 10
−2
8.2 × 10
−3
2.9 × 10
−2
Grasses
Stems and
shoots
All
147
1.7 × 10
−2
9.4
2.0 × 10
−4
5.5
Sand
19
1.6 × 10
−2
1.7 × 10
1
5.5 × 10
−4
1.8
Loam
34
9.8 × 10
−3
8.4
3.1 × 10
−4
4.6 × 10
−1
Pasture
Stems and
shoots
All
53
4.6 × 10
−2
5.3
1.3 × 10
−3
1.4 × 10
1
Sand
3
2.7 × 10
−3
1.8
1.3 × 10
−3
3.9 × 10
−3
Loam
7
7.2 × 10
−2
3.3 × 10
1
1.8 × 10
−3
1.4 × 10
1
Leguminous
fodder
Stems and
shoots
All
15
1.5 × 10
−2
4.2
2.0 × 10
−3
1.6
Sand
12
1.0 × 10
−2
2.0
2.0 × 10
−3
2.1 × 10
−2
Assessment Modelling and the Evaluation of Radiological and Chemical Impacts…