

197
recognised and values are highly variable. For uranium, F v values cited in IAEA
(2010) range over more than five orders of magnitude. However, in general uranium
is bioexcluded from plants rather than bioaccumulated. Recommended geometric
mean and geometric standard deviation values for different types of plants and different plant parts are listed in Table 2, together with the minimum and maximum
values recorded. Where possible, distinctions between different soil types are also
made.
This data set was used by Vandenhove et al. (2009) to analyse differences
between crop groups. They reported that fodder, pasture and herbs had the highest
values (2.3 × 10
−2
to 6.5 × 10
−2
), with legumes, tuber and cereals the lowest values
(2.2 × 10
−3
to 6.5 × 10
−3
) and that differences were significant (p < 0.05). Data
within crop groups were variable with a range of two or three orders of magnitude
being common. The authors concluded that experimental conditions, climate, soil
parameters (pH, cation exchange capacity, organic matter or clay content, amorphous Fe) and contamination event did not significantly affect transfer factors.
Relatively extensive data for F v values are also available for tropical environments (IAEA 2010; Saeed et al. 2011; Kritsananuwat et al. 2015), and data are also
available for sub-tropical regions (Jazzar and Thabayneh 2014; Skoko et al. 2014)
and for forests in Finland (Roivainen et al. 2011), Norway (Popic et al. 2011) and
Southern India (Manigandan and Shekar 2014).
In general, uranium tends to accumulate in the roots of plants rather than aboveground parts (Kohler et al. 2000; Chen et al. 2005; Laroche et al. 2005; Pulhani et al.
2005; Al-Kharouf et al. 2008; Shtangeeva 2010; Soudek et al. 2014). Also, there is
contradictory evidence as to whether the accumulation of uranium increases with
the age of the plant or plant part (Sheppard and Evenden 1988; Saric et al. 1995;
Soudek et al. 2014).
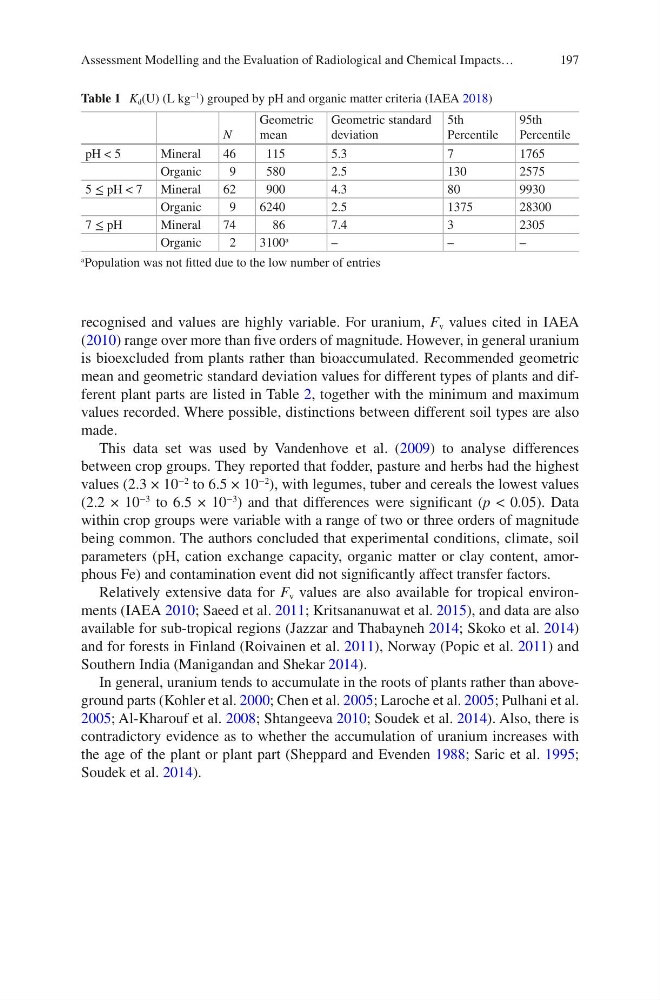
Table 1 K d (U) (L kg
−1 ) grouped by pH and organic matter criteria (IAEA 2018)
N
Geometric
mean
Geometric standard
deviation
5th
Percentile
95th
Percentile
pH < 5
Mineral
46
115
5.3
7
1765
Organic
9
580
2.5
130
2575
5 ≤ pH < 7 Mineral
62
900
4.3
80
9930
Organic
9
6240
2.5
1375
28300
7 ≤ pH
Mineral
74
86
7.4
3
2305
Organic
2
3100
a
–
–
–
a
Population was not fitted due to the low number of entries
Assessment Modelling and the Evaluation of Radiological and Chemical Impacts…
recognised and values are highly variable. For uranium, F v values cited in IAEA
(2010) range over more than five orders of magnitude. However, in general uranium
is bioexcluded from plants rather than bioaccumulated. Recommended geometric
mean and geometric standard deviation values for different types of plants and different plant parts are listed in Table 2, together with the minimum and maximum
values recorded. Where possible, distinctions between different soil types are also
made.
This data set was used by Vandenhove et al. (2009) to analyse differences
between crop groups. They reported that fodder, pasture and herbs had the highest
values (2.3 × 10
−2
to 6.5 × 10
−2
), with legumes, tuber and cereals the lowest values
(2.2 × 10
−3
to 6.5 × 10
−3
) and that differences were significant (p < 0.05). Data
within crop groups were variable with a range of two or three orders of magnitude
being common. The authors concluded that experimental conditions, climate, soil
parameters (pH, cation exchange capacity, organic matter or clay content, amorphous Fe) and contamination event did not significantly affect transfer factors.
Relatively extensive data for F v values are also available for tropical environments (IAEA 2010; Saeed et al. 2011; Kritsananuwat et al. 2015), and data are also
available for sub-tropical regions (Jazzar and Thabayneh 2014; Skoko et al. 2014)
and for forests in Finland (Roivainen et al. 2011), Norway (Popic et al. 2011) and
Southern India (Manigandan and Shekar 2014).
In general, uranium tends to accumulate in the roots of plants rather than aboveground parts (Kohler et al. 2000; Chen et al. 2005; Laroche et al. 2005; Pulhani et al.
2005; Al-Kharouf et al. 2008; Shtangeeva 2010; Soudek et al. 2014). Also, there is
contradictory evidence as to whether the accumulation of uranium increases with
the age of the plant or plant part (Sheppard and Evenden 1988; Saric et al. 1995;
Soudek et al. 2014).
Table 1 K d (U) (L kg
−1 ) grouped by pH and organic matter criteria (IAEA 2018)
N
Geometric
mean
Geometric standard
deviation
5th
Percentile
95th
Percentile
pH < 5
Mineral
46
115
5.3
7
1765
Organic
9
580
2.5
130
2575
5 ≤ pH < 7 Mineral
62
900
4.3
80
9930
Organic
9
6240
2.5
1375
28300
7 ≤ pH
Mineral
74
86
7.4
3
2305
Organic
2
3100
a
–
–
–
a
Population was not fitted due to the low number of entries
Assessment Modelling and the Evaluation of Radiological and Chemical Impacts…