

175
might be readily available to plants; therefore, we hypothesized that ess U concentration in soils and U in crops grown in the soils would be positively correlated, if ess U
was in soluble forms in soil after its application. Among the crops we used in this
study, there were large numbers of brown rice (N = 98) and potato (N = 46) samples.
Thus, using their data sets, we analyzed their correlations.
The results are shown in Fig. 9. From these figures and statistical analyses, we
confirmed that there were no correlations between crop U concentrations and ess U in
soil. We also found that total U concentration did not have any correlations, as
Vandenhove et al. (2007) suggested. They reported that it was difficult to predict U
concentrations in plants from the total U and the water-soluble U concentrations;
although to their multiple linear regression analysis they added data related to the U
species, those species which were probably the uranyl species that are most readily
taken up by plants, the results still provided poor correlation with the observed TF
(R = 0.65). The results implied that added U was not bioavailable and thus should
have affected little in U concentration in crops.
However, if the ess U amount was higher or lower compared to that of the initial U
( init U) in soil, U transfer to crops might be affected because of the different physicochemical forms of ess U and init U. To ignore the total U concentration effect, the values of TF defined as “concentration of U in crop (mg kg
−1
-dry)/concentration of U
in soil (mg kg
−1
-dry)” were calculated, and then selected data were categorized into
two groups, that is, a concentration ratio of ess U/ init U of (1) more than 2 and (2) less
than 0.5. TF results for brown rice and potato were used for this analysis and they
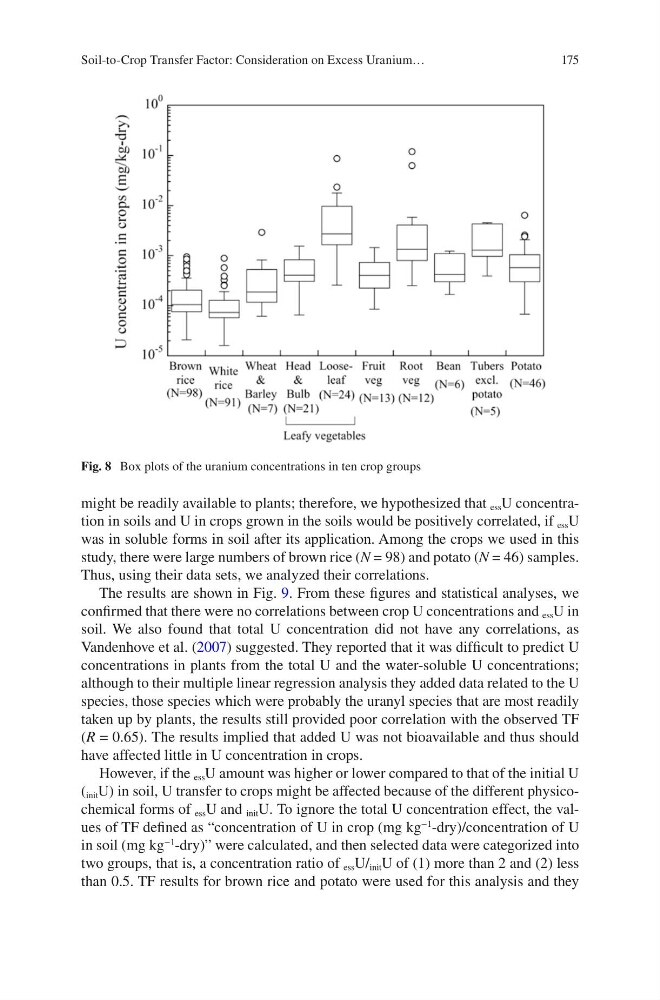
Fig. 8 Box plots of the uranium concentrations in ten crop groups
Soil-to-Crop Transfer Factor: Consideration on Excess Uranium…
might be readily available to plants; therefore, we hypothesized that ess U concentration in soils and U in crops grown in the soils would be positively correlated, if ess U
was in soluble forms in soil after its application. Among the crops we used in this
study, there were large numbers of brown rice (N = 98) and potato (N = 46) samples.
Thus, using their data sets, we analyzed their correlations.
The results are shown in Fig. 9. From these figures and statistical analyses, we
confirmed that there were no correlations between crop U concentrations and ess U in
soil. We also found that total U concentration did not have any correlations, as
Vandenhove et al. (2007) suggested. They reported that it was difficult to predict U
concentrations in plants from the total U and the water-soluble U concentrations;
although to their multiple linear regression analysis they added data related to the U
species, those species which were probably the uranyl species that are most readily
taken up by plants, the results still provided poor correlation with the observed TF
(R = 0.65). The results implied that added U was not bioavailable and thus should
have affected little in U concentration in crops.
However, if the ess U amount was higher or lower compared to that of the initial U
( init U) in soil, U transfer to crops might be affected because of the different physicochemical forms of ess U and init U. To ignore the total U concentration effect, the values of TF defined as “concentration of U in crop (mg kg
−1
-dry)/concentration of U
in soil (mg kg
−1
-dry)” were calculated, and then selected data were categorized into
two groups, that is, a concentration ratio of ess U/ init U of (1) more than 2 and (2) less
than 0.5. TF results for brown rice and potato were used for this analysis and they
Fig. 8 Box plots of the uranium concentrations in ten crop groups
Soil-to-Crop Transfer Factor: Consideration on Excess Uranium…