

173
3 Correlations Between U in Crops and ess U
in Corresponding Agricultural Soils
3.1 Concentrations of U in Crops
Uranium concentrations in edible part of crops (98 rice samples and 147 upland
field crop samples) were measured using ICP-MS. Details of the method are found
in our previous paper (Uchida et al. 2007a). Although ICP-MS has a low detection
limit, U concentrations were under the detection limit in 15 samples; these data
were removed from further analysis. Table 4 shows the U concentration data for
crops and their categorized groups. Brown rice is hulled rice of Oryza sativa (japonica type), and white rice is obtained by polishing the rice grain by removing rice
bran (ca. 9% of the total grain weight). The U concentration in each group is summarized in Fig. 8. Although rice and potato are cereals and tubers, respectively,
numbers of samples for these crops were large so that they were plotted individually. Loose-leaf-type vegetables showed higher U concentration than other crops,
while white rice showed the lowest.
3.2 Correlations Between U in Crops and ess U in Soil
It has been reported that U from phosphate fertilizer is soluble in water (Tsumura
and Yamasaki 1993; Zielinski et al. 2000). If U is in soluble form, it is easily taken
up by plant roots (Dushenkov et al. 1997; Soudek et al. 2011). This means that ess U
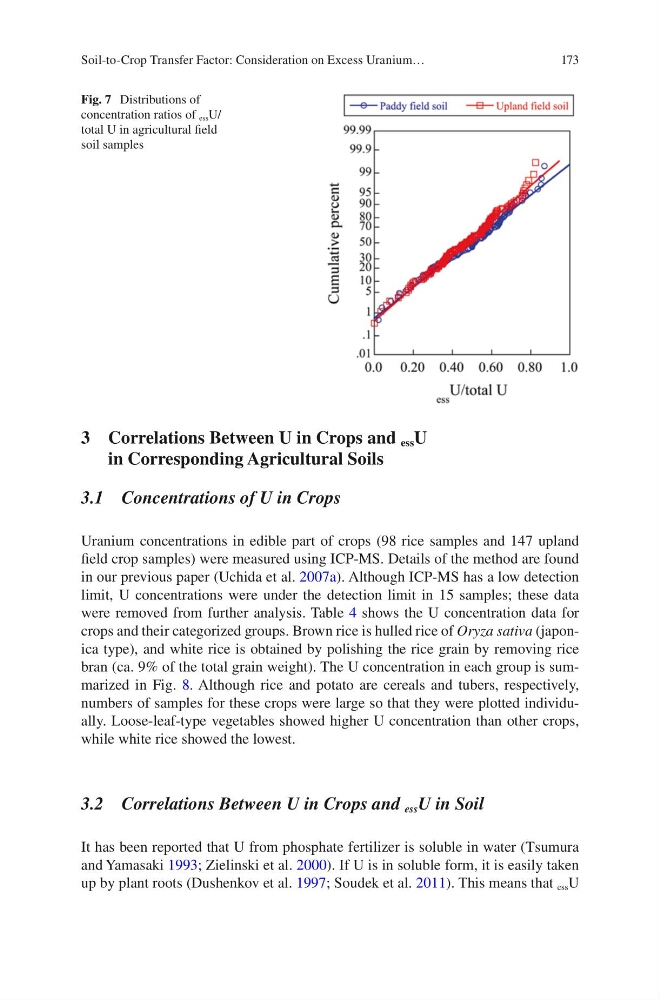
Fig. 7 Distributions of
concentration ratios of ess U/
total U in agricultural field
soil samples
Soil-to-Crop Transfer Factor: Consideration on Excess Uranium…
3 Correlations Between U in Crops and ess U
in Corresponding Agricultural Soils
3.1 Concentrations of U in Crops
Uranium concentrations in edible part of crops (98 rice samples and 147 upland
field crop samples) were measured using ICP-MS. Details of the method are found
in our previous paper (Uchida et al. 2007a). Although ICP-MS has a low detection
limit, U concentrations were under the detection limit in 15 samples; these data
were removed from further analysis. Table 4 shows the U concentration data for
crops and their categorized groups. Brown rice is hulled rice of Oryza sativa (japonica type), and white rice is obtained by polishing the rice grain by removing rice
bran (ca. 9% of the total grain weight). The U concentration in each group is summarized in Fig. 8. Although rice and potato are cereals and tubers, respectively,
numbers of samples for these crops were large so that they were plotted individually. Loose-leaf-type vegetables showed higher U concentration than other crops,
while white rice showed the lowest.
3.2 Correlations Between U in Crops and ess U in Soil
It has been reported that U from phosphate fertilizer is soluble in water (Tsumura
and Yamasaki 1993; Zielinski et al. 2000). If U is in soluble form, it is easily taken
up by plant roots (Dushenkov et al. 1997; Soudek et al. 2011). This means that ess U
Fig. 7 Distributions of
concentration ratios of ess U/
total U in agricultural field
soil samples
Soil-to-Crop Transfer Factor: Consideration on Excess Uranium…