

171
et al. (2006) showed an example of this phenomenon. Therefore, to estimate ess U
concentration, we assumed that excess Th from fertilizers was negligible and thus
all Th was initial Th in the soil.
Using Eq. (1), ess U concentration in each soil sample was estimated. For some
soil samples, calculated ess U was negative; thus the data were removed. Although the
distributions of ess U concentrations in two soil uses did not fit to log-normal curves
well (Fig. 6), we could compare the data with total U, GM values, geometric standard deviation (GSD), and ranges that are listed in Table 3. Estimated ess U in upland
field and paddy field soil samples were not significantly different by t-test. The GM
Table 2 (continued)
Bedrock
a
Prefecture Th, mg kg
-1 U, mg kg
-1 U/Th References
RM
b
Chert
Tochigi
0.74
0.74
1.0 AIST (2018)
JCh-1
Shale
Akita
3.11
2.09
0.67 Kimura et al. (2003)
Shale
Akita
3.45
6.48
1.9 Kimura et al. (2003)
Shale
Akita
6.74
2.58
0.38 Kimura et al. (2003)
GM
1.29
2.04
1.58
Soil from sedimentary
rock
7.63
1.83
0.24 Minato (2005)
a
Bedrock types were (1) volcanic, andesite, basalt, and rhyolite; (2) plutonic, granodiorite and
granite; and (3) sedimentary, limestone, dolomite, slate, chert, and shale
b
RM reference material code
c
GM geometric mean
d
GD granodiorite
e
GR granite
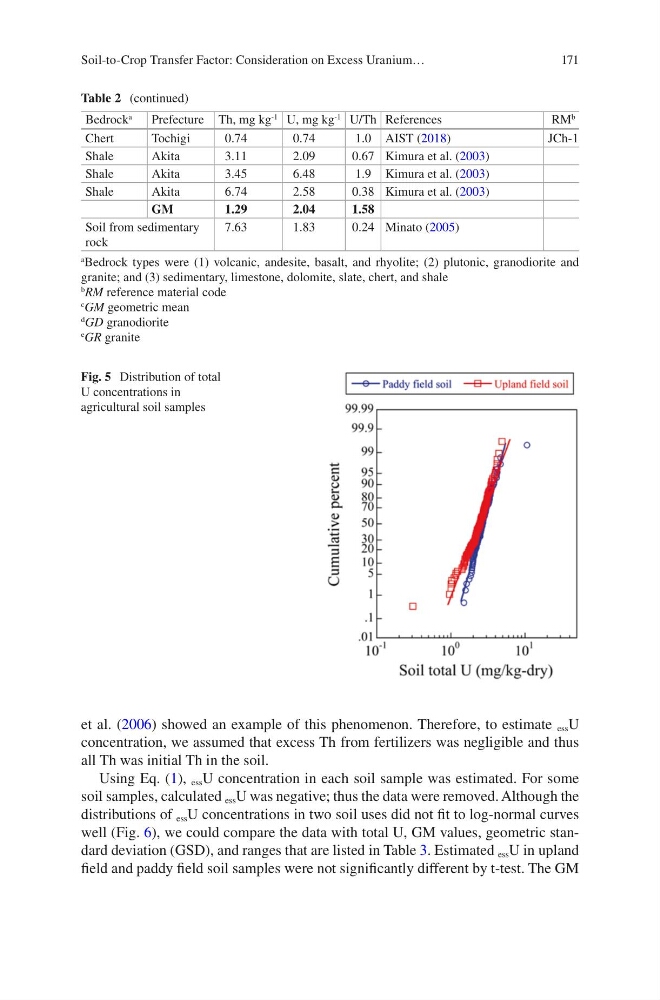
Fig. 5 Distribution of total
U concentrations in
agricultural soil samples
Soil-to-Crop Transfer Factor: Consideration on Excess Uranium…
et al. (2006) showed an example of this phenomenon. Therefore, to estimate ess U
concentration, we assumed that excess Th from fertilizers was negligible and thus
all Th was initial Th in the soil.
Using Eq. (1), ess U concentration in each soil sample was estimated. For some
soil samples, calculated ess U was negative; thus the data were removed. Although the
distributions of ess U concentrations in two soil uses did not fit to log-normal curves
well (Fig. 6), we could compare the data with total U, GM values, geometric standard deviation (GSD), and ranges that are listed in Table 3. Estimated ess U in upland
field and paddy field soil samples were not significantly different by t-test. The GM
Table 2 (continued)
Bedrock
a
Prefecture Th, mg kg
-1 U, mg kg
-1 U/Th References
RM
b
Chert
Tochigi
0.74
0.74
1.0 AIST (2018)
JCh-1
Shale
Akita
3.11
2.09
0.67 Kimura et al. (2003)
Shale
Akita
3.45
6.48
1.9 Kimura et al. (2003)
Shale
Akita
6.74
2.58
0.38 Kimura et al. (2003)
GM
1.29
2.04
1.58
Soil from sedimentary
rock
7.63
1.83
0.24 Minato (2005)
a
Bedrock types were (1) volcanic, andesite, basalt, and rhyolite; (2) plutonic, granodiorite and
granite; and (3) sedimentary, limestone, dolomite, slate, chert, and shale
b
RM reference material code
c
GM geometric mean
d
GD granodiorite
e
GR granite
Fig. 5 Distribution of total
U concentrations in
agricultural soil samples
Soil-to-Crop Transfer Factor: Consideration on Excess Uranium…