

168
values of their reported values. Yamagata and Iwashima (1967) collected 172 samples throughout Japan from which they made 22 composite samples that had the
GM = 0.219 by our calculation. Minato (2005) surveyed literature values, and he
had 1308 data sets (data were summarized into 15 groups) from eight prefectures
that had the GM = 0.237 by our calculation. Although our sample numbers were
smaller than those reported by Minato (2005), our area coverage was larger, and we
could obtain more data than those reported by Yamagata and Iwashima (1967);
therefore, we decided to use our own U/Th data including data from Yamagata and
Iwashima (1967) and Minato (2005). The GM value of our U/Th data was 0.258,
and the value was used hereafter in this study as “ init U/Th.”
Table 1 Uranium and thorium concentrations and geometric mean (GM) U/Th ratio in
nonagricultural soils and river sediments collected in Japan
Data source
Th
mg kg
−1 -dry
U
mg kg
−1 -dry
U/Th ratio
(range)
Comments
Nonagricultural soils,
This study
7.35
(0.39–36.9)
1.90
(0.24–10.5)
0.258
(0.058–0.899)
210 samples,
21 prefectures
Nonagricultural soils,
Minato (2005)
8.13
(3.88–29.4)
1.84
(0.97–5.96)
0.237
(0.179–0.306)
Data summarized for 15
samples (from 1308
samples),
8 prefectures
Nonagricultural soils,
Yamagata and
Iwashima (1967)
5.44
(3.0–9.3)
1.19
(0.26–2.89)
0.219
(0.048–0.567)
Data for 22 composite
samples (prepared from
172 samples), all Japan
River sediments,
Imai et al. (2004)
5.45
(0.43–363)
1.32
(0.12–86.2)
0.241
(0.036–1.65)
3024 samples,
all Japan
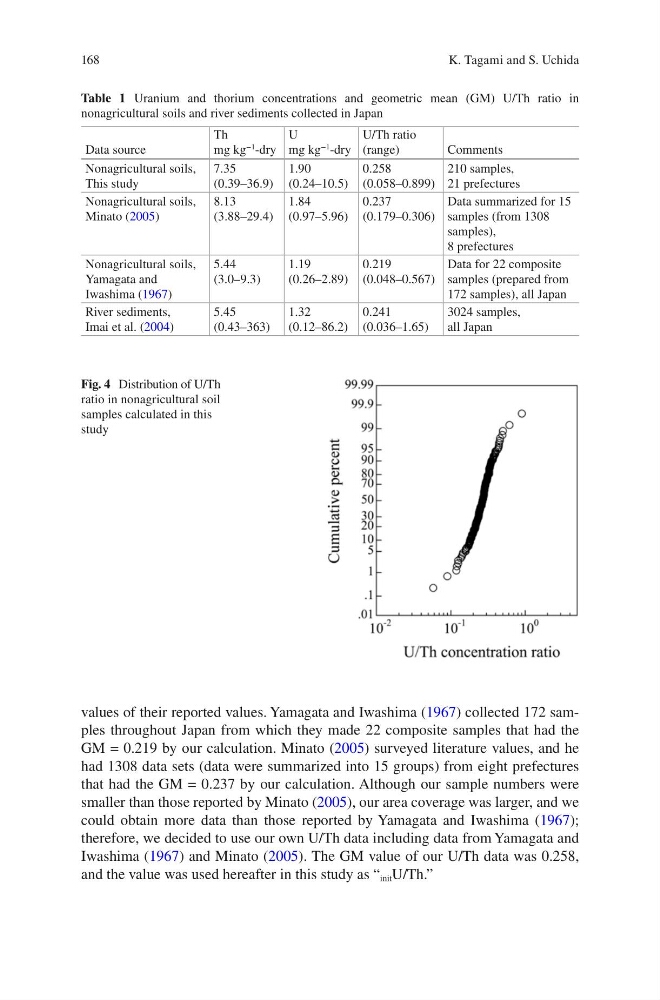
Fig. 4 Distribution of U/Th
ratio in nonagricultural soil
samples calculated in this
study
K. Tagami and S. Uchida
values of their reported values. Yamagata and Iwashima (1967) collected 172 samples throughout Japan from which they made 22 composite samples that had the
GM = 0.219 by our calculation. Minato (2005) surveyed literature values, and he
had 1308 data sets (data were summarized into 15 groups) from eight prefectures
that had the GM = 0.237 by our calculation. Although our sample numbers were
smaller than those reported by Minato (2005), our area coverage was larger, and we
could obtain more data than those reported by Yamagata and Iwashima (1967);
therefore, we decided to use our own U/Th data including data from Yamagata and
Iwashima (1967) and Minato (2005). The GM value of our U/Th data was 0.258,
and the value was used hereafter in this study as “ init U/Th.”
Table 1 Uranium and thorium concentrations and geometric mean (GM) U/Th ratio in
nonagricultural soils and river sediments collected in Japan
Data source
Th
mg kg
−1 -dry
U
mg kg
−1 -dry
U/Th ratio
(range)
Comments
Nonagricultural soils,
This study
7.35
(0.39–36.9)
1.90
(0.24–10.5)
0.258
(0.058–0.899)
210 samples,
21 prefectures
Nonagricultural soils,
Minato (2005)
8.13
(3.88–29.4)
1.84
(0.97–5.96)
0.237
(0.179–0.306)
Data summarized for 15
samples (from 1308
samples),
8 prefectures
Nonagricultural soils,
Yamagata and
Iwashima (1967)
5.44
(3.0–9.3)
1.19
(0.26–2.89)
0.219
(0.048–0.567)
Data for 22 composite
samples (prepared from
172 samples), all Japan
River sediments,
Imai et al. (2004)
5.45
(0.43–363)
1.32
(0.12–86.2)
0.241
(0.036–1.65)
3024 samples,
all Japan
Fig. 4 Distribution of U/Th
ratio in nonagricultural soil
samples calculated in this
study
K. Tagami and S. Uchida