

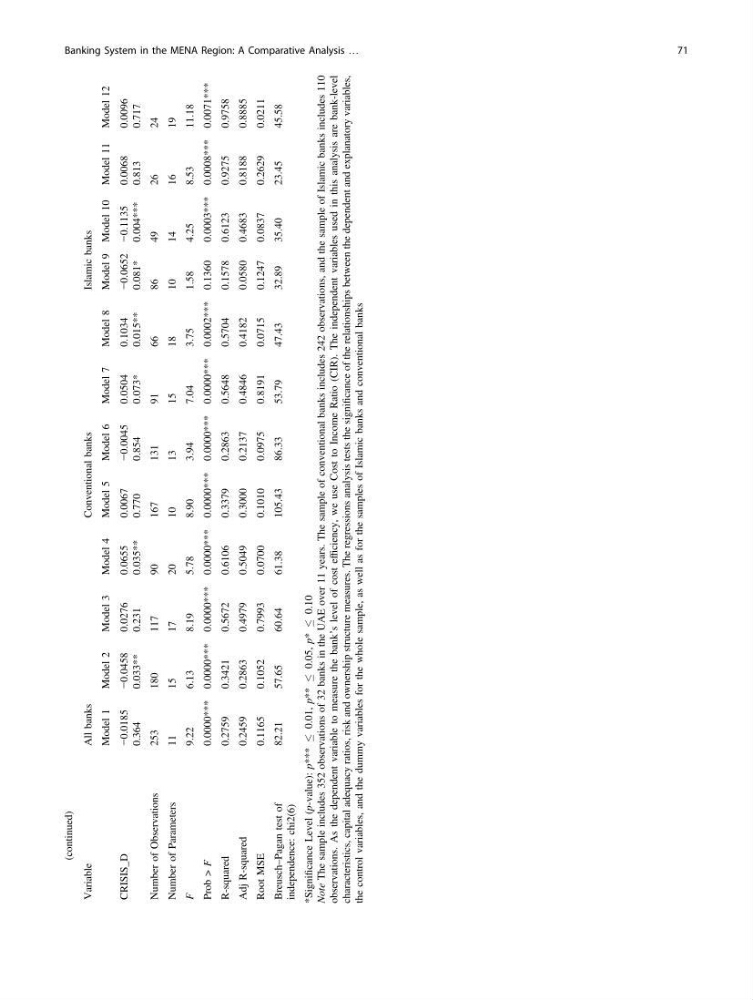
Table 5
(continued)
Variable
All banks
Conventional banks
Islamic banks
Model 1
Model 2
Model 3
Model 4
Model 5
Model 6
Model 7
Model 8
Model 9 Model 10 Model 11 Model 12
CRISIS_D
−0.0185
0.364
−0.0458
0.033**
0.0276
0.231
0.0655
0.035**
0.0067
0.770
−0.0045
0.854
0.0504
0.073*
0.1034
0.015**
−0.0652
0.081*
−0.1135
0.004***
0.0068
0.813
0.0096
0.717
Number of Observations
253
180
117
90
167
131
91
66
86
49
26
24
Number of Parameters
11
15
17
20
10
13
15
18
10
14
16
19
F
9.22
6.13
8.19
5.78
8.90
3.94
7.04
3.75
1.58
4.25
8.53
11.18
Prob > F
0.0000*** 0.0000*** 0.0000*** 0.0000*** 0.0000*** 0.0000*** 0.0000*** 0.0002*** 0.1360
0.0003*** 0.0008*** 0.0071***
R-squared
0.2759
0.3421
0.5672
0.6106
0.3379
0.2863
0.5648
0.5704
0.1578
0.6123
0.9275
0.9758
Adj R-squared
0.2459
0.2863
0.4979
0.5049
0.3000
0.2137
0.4846
0.4182
0.0580
0.4683
0.8188
0.8885
Root MSE
0.1165
0.1052
0.7993
0.0700
0.1010
0.0975
0.8191
0.0715
0.1247
0.0837
0.2629
0.0211
Breusch–Pagan test of
independence: chi2(6)
82.21
57.65
60.64
61.38
105.43
86.33
53.79
47.43
32.89
35.40
23.45
45.58
*Significance Level (p-value): p***
0.01, p**
0.05, p*
0.10
Note
The sample includes 352 observations of 32 banks in the UAE over 11 years. The sample of conventional banks includes 242 observations, and the sample of Islamic banks includes 110
observations. As the dependent variable to measure the bank’s level of cost efficiency, we use Cost to Income Ratio (CIR). The independent variables used in this analysis are bank-level
characteristics, capital adequacy ratios, risk and ownership structure measures. The regressions analysis tests the significance of the relationships between the dependent and explanatory variables,
the control variables, and the dummy variables for the whole sample, as well as for the samples of Islamic banks and conventional banks
Banking System in the MENA Region: A Comparative Analysis …
71
(continued)
Variable
All banks
Conventional banks
Islamic banks
Model 1
Model 2
Model 3
Model 4
Model 5
Model 6
Model 7
Model 8
Model 9 Model 10 Model 11 Model 12
CRISIS_D
−0.0185
0.364
−0.0458
0.033**
0.0276
0.231
0.0655
0.035**
0.0067
0.770
−0.0045
0.854
0.0504
0.073*
0.1034
0.015**
−0.0652
0.081*
−0.1135
0.004***
0.0068
0.813
0.0096
0.717
Number of Observations
253
180
117
90
167
131
91
66
86
49
26
24
Number of Parameters
11
15
17
20
10
13
15
18
10
14
16
19
F
9.22
6.13
8.19
5.78
8.90
3.94
7.04
3.75
1.58
4.25
8.53
11.18
Prob > F
0.0000*** 0.0000*** 0.0000*** 0.0000*** 0.0000*** 0.0000*** 0.0000*** 0.0002*** 0.1360
0.0003*** 0.0008*** 0.0071***
R-squared
0.2759
0.3421
0.5672
0.6106
0.3379
0.2863
0.5648
0.5704
0.1578
0.6123
0.9275
0.9758
Adj R-squared
0.2459
0.2863
0.4979
0.5049
0.3000
0.2137
0.4846
0.4182
0.0580
0.4683
0.8188
0.8885
Root MSE
0.1165
0.1052
0.7993
0.0700
0.1010
0.0975
0.8191
0.0715
0.1247
0.0837
0.2629
0.0211
Breusch–Pagan test of
independence: chi2(6)
82.21
57.65
60.64
61.38
105.43
86.33
53.79
47.43
32.89
35.40
23.45
45.58
*Significance Level (p-value): p***
0.01, p**
0.05, p*
0.10
Note
The sample includes 352 observations of 32 banks in the UAE over 11 years. The sample of conventional banks includes 242 observations, and the sample of Islamic banks includes 110
observations. As the dependent variable to measure the bank’s level of cost efficiency, we use Cost to Income Ratio (CIR). The independent variables used in this analysis are bank-level
characteristics, capital adequacy ratios, risk and ownership structure measures. The regressions analysis tests the significance of the relationships between the dependent and explanatory variables,
the control variables, and the dummy variables for the whole sample, as well as for the samples of Islamic banks and conventional banks
Banking System in the MENA Region: A Comparative Analysis …
71