

3. Regression analysis: This type of analysis is to test the
significance of the relationship between a bank’s performance in terms of cost efficiency and profitability and
the variables that are expected to have a strong influence
on different types of banks. As mentioned above, we use
two cost efficiency measures: Cost to Income (CIR) ratio
and Net Interest Margin (NIM), and two profitability
measures: Earning Assets to Total Assets (EARTA) ratio
and Earning Assets on Gross Loans (EARGL) ratio, and
analyze the differences in the effects of bank-specific
characteristics, capital adequacy, risk measures, and
ownership structure on the performance of CBs and IBs.
Based on the power and the sample size, we perform
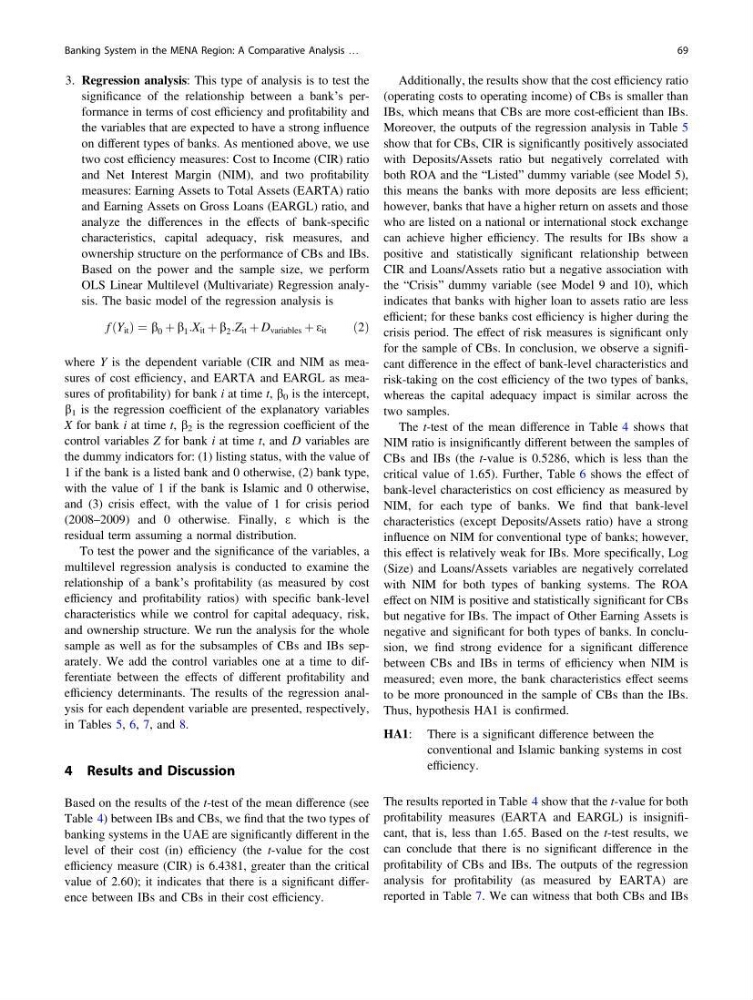
OLS Linear Multilevel (Multivariate) Regression analysis. The basic model of the regression analysis is
f Y it
ð Þ ¼ b 0 þ b 1 :X it þ b 2 :Z it þ D variables þ e it
ð2Þ
where Y is the dependent variable (CIR and NIM as measures of cost efficiency, and EARTA and EARGL as measures of profitability) for bank i at time t, b 0 is the intercept,
b 1 is the regression coefficient of the explanatory variables
X for bank i at time t, b 2 is the regression coefficient of the
control variables Z for bank i at time t, and D variables are
the dummy indicators for: (1) listing status, with the value of
1 if the bank is a listed bank and 0 otherwise, (2) bank type,
with the value of 1 if the bank is Islamic and 0 otherwise,
and (3) crisis effect, with the value of 1 for crisis period
(2008–2009) and 0 otherwise. Finally, e which is the
residual term assuming a normal distribution.
To test the power and the significance of the variables, a
multilevel regression analysis is conducted to examine the
relationship of a bank’s profitability (as measured by cost
efficiency and profitability ratios) with specific bank-level
characteristics while we control for capital adequacy, risk,
and ownership structure. We run the analysis for the whole
sample as well as for the subsamples of CBs and IBs separately. We add the control variables one at a time to differentiate between the effects of different profitability and
efficiency determinants. The results of the regression analysis for each dependent variable are presented, respectively,
in Tables 5, 6, 7, and 8.
4 Results and Discussion
Based on the results of the t-test of the mean difference (see
Table 4) between IBs and CBs, we find that the two types of
banking systems in the UAE are significantly different in the
level of their cost (in) efficiency (the t-value for the cost
efficiency measure (CIR) is 6.4381, greater than the critical
value of 2.60); it indicates that there is a significant difference between IBs and CBs in their cost efficiency.
Additionally, the results show that the cost efficiency ratio
(operating costs to operating income) of CBs is smaller than
IBs, which means that CBs are more cost-efficient than IBs.
Moreover, the outputs of the regression analysis in Table 5
show that for CBs, CIR is significantly positively associated
with Deposits/Assets ratio but negatively correlated with
both ROA and the “Listed” dummy variable (see Model 5),
this means the banks with more deposits are less efficient;
however, banks that have a higher return on assets and those
who are listed on a national or international stock exchange
can achieve higher efficiency. The results for IBs show a
positive and statistically significant relationship between
CIR and Loans/Assets ratio but a negative association with
the “Crisis” dummy variable (see Model 9 and 10), which
indicates that banks with higher loan to assets ratio are less
efficient; for these banks cost efficiency is higher during the
crisis period. The effect of risk measures is significant only
for the sample of CBs. In conclusion, we observe a significant difference in the effect of bank-level characteristics and
risk-taking on the cost efficiency of the two types of banks,
whereas the capital adequacy impact is similar across the
two samples.
The t-test of the mean difference in Table 4 shows that
NIM ratio is insignificantly different between the samples of
CBs and IBs (the t-value is 0.5286, which is less than the
critical value of 1.65). Further, Table 6 shows the effect of
bank-level characteristics on cost efficiency as measured by
NIM, for each type of banks. We find that bank-level
characteristics (except Deposits/Assets ratio) have a strong
influence on NIM for conventional type of banks; however,
this effect is relatively weak for IBs. More specifically, Log
(Size) and Loans/Assets variables are negatively correlated
with NIM for both types of banking systems. The ROA
effect on NIM is positive and statistically significant for CBs
but negative for IBs. The impact of Other Earning Assets is
negative and significant for both types of banks. In conclusion, we find strong evidence for a significant difference
between CBs and IBs in terms of efficiency when NIM is
measured; even more, the bank characteristics effect seems
to be more pronounced in the sample of CBs than the IBs.
Thus, hypothesis HA1 is confirmed.
HA1: There is a significant difference between the
conventional and Islamic banking systems in cost
efficiency.
The results reported in Table 4 show that the t-value for both
profitability measures (EARTA and EARGL) is insignificant, that is, less than 1.65. Based on the t-test results, we
can conclude that there is no significant difference in the
profitability of CBs and IBs. The outputs of the regression
analysis for profitability (as measured by EARTA) are
reported in Table 7. We can witness that both CBs and IBs
Banking System in the MENA Region: A Comparative Analysis …
69
significance of the relationship between a bank’s performance in terms of cost efficiency and profitability and
the variables that are expected to have a strong influence
on different types of banks. As mentioned above, we use
two cost efficiency measures: Cost to Income (CIR) ratio
and Net Interest Margin (NIM), and two profitability
measures: Earning Assets to Total Assets (EARTA) ratio
and Earning Assets on Gross Loans (EARGL) ratio, and
analyze the differences in the effects of bank-specific
characteristics, capital adequacy, risk measures, and
ownership structure on the performance of CBs and IBs.
Based on the power and the sample size, we perform
OLS Linear Multilevel (Multivariate) Regression analysis. The basic model of the regression analysis is
f Y it
ð Þ ¼ b 0 þ b 1 :X it þ b 2 :Z it þ D variables þ e it
ð2Þ
where Y is the dependent variable (CIR and NIM as measures of cost efficiency, and EARTA and EARGL as measures of profitability) for bank i at time t, b 0 is the intercept,
b 1 is the regression coefficient of the explanatory variables
X for bank i at time t, b 2 is the regression coefficient of the
control variables Z for bank i at time t, and D variables are
the dummy indicators for: (1) listing status, with the value of
1 if the bank is a listed bank and 0 otherwise, (2) bank type,
with the value of 1 if the bank is Islamic and 0 otherwise,
and (3) crisis effect, with the value of 1 for crisis period
(2008–2009) and 0 otherwise. Finally, e which is the
residual term assuming a normal distribution.
To test the power and the significance of the variables, a
multilevel regression analysis is conducted to examine the
relationship of a bank’s profitability (as measured by cost
efficiency and profitability ratios) with specific bank-level
characteristics while we control for capital adequacy, risk,
and ownership structure. We run the analysis for the whole
sample as well as for the subsamples of CBs and IBs separately. We add the control variables one at a time to differentiate between the effects of different profitability and
efficiency determinants. The results of the regression analysis for each dependent variable are presented, respectively,
in Tables 5, 6, 7, and 8.
4 Results and Discussion
Based on the results of the t-test of the mean difference (see
Table 4) between IBs and CBs, we find that the two types of
banking systems in the UAE are significantly different in the
level of their cost (in) efficiency (the t-value for the cost
efficiency measure (CIR) is 6.4381, greater than the critical
value of 2.60); it indicates that there is a significant difference between IBs and CBs in their cost efficiency.
Additionally, the results show that the cost efficiency ratio
(operating costs to operating income) of CBs is smaller than
IBs, which means that CBs are more cost-efficient than IBs.
Moreover, the outputs of the regression analysis in Table 5
show that for CBs, CIR is significantly positively associated
with Deposits/Assets ratio but negatively correlated with
both ROA and the “Listed” dummy variable (see Model 5),
this means the banks with more deposits are less efficient;
however, banks that have a higher return on assets and those
who are listed on a national or international stock exchange
can achieve higher efficiency. The results for IBs show a
positive and statistically significant relationship between
CIR and Loans/Assets ratio but a negative association with
the “Crisis” dummy variable (see Model 9 and 10), which
indicates that banks with higher loan to assets ratio are less
efficient; for these banks cost efficiency is higher during the
crisis period. The effect of risk measures is significant only
for the sample of CBs. In conclusion, we observe a significant difference in the effect of bank-level characteristics and
risk-taking on the cost efficiency of the two types of banks,
whereas the capital adequacy impact is similar across the
two samples.
The t-test of the mean difference in Table 4 shows that
NIM ratio is insignificantly different between the samples of
CBs and IBs (the t-value is 0.5286, which is less than the
critical value of 1.65). Further, Table 6 shows the effect of
bank-level characteristics on cost efficiency as measured by
NIM, for each type of banks. We find that bank-level
characteristics (except Deposits/Assets ratio) have a strong
influence on NIM for conventional type of banks; however,
this effect is relatively weak for IBs. More specifically, Log
(Size) and Loans/Assets variables are negatively correlated
with NIM for both types of banking systems. The ROA
effect on NIM is positive and statistically significant for CBs
but negative for IBs. The impact of Other Earning Assets is
negative and significant for both types of banks. In conclusion, we find strong evidence for a significant difference
between CBs and IBs in terms of efficiency when NIM is
measured; even more, the bank characteristics effect seems
to be more pronounced in the sample of CBs than the IBs.
Thus, hypothesis HA1 is confirmed.
HA1: There is a significant difference between the
conventional and Islamic banking systems in cost
efficiency.
The results reported in Table 4 show that the t-value for both
profitability measures (EARTA and EARGL) is insignificant, that is, less than 1.65. Based on the t-test results, we
can conclude that there is no significant difference in the
profitability of CBs and IBs. The outputs of the regression
analysis for profitability (as measured by EARTA) are
reported in Table 7. We can witness that both CBs and IBs
Banking System in the MENA Region: A Comparative Analysis …
69