

We use descriptive analysis and t-test of mean difference
to examine the difference between the sample of CBs and
IBs. In addition, correlation and covariance analysis,
2 as well
as multivariate regressions, are used to test the relationship
among the variables. The significance of the relationship is
tested for both the full sample and the subsamples (IBs and
CBs) using different measures of cost efficiency and profitability. In brief, we use the following types of analysis
(techniques):
1. Descriptive analysis: The descriptive analysis is performed for 11 years of observation (2005–2015) and 23
variables. The descriptive statistics are the mean, maximum & minimum, and standard deviation. The sample
includes 352 observations for 32 UAE banks, respectively; the number of observations is 242 for CBs and
110 for IBs. The descriptive statistics for both types of
banks are presented in Table 4.
2. The t-test for the mean difference analysis: The t-test is
used to test the mean difference between the two banking
samples (two independent samples), using the following
equation:
t ¼
ffiffiffiffiffiffiffiffiffiffiffiffiffiffiffiffiffiffiffiffiffiffiffi
SD
2
1
N 1
þ
SD
2
2
N 2
s
ð1Þ
where SD—standard deviation, SE—standard error, significance level = 5%, confidence level = 95%, Z—value for
95% confidence level is 1.965, and critical t-value at 10%,
5%, and 1% significance level is 1.65, 1.97, and 2.60,
respectively. The t-value and the p-value for the mean difference tests are presented in Table 4.
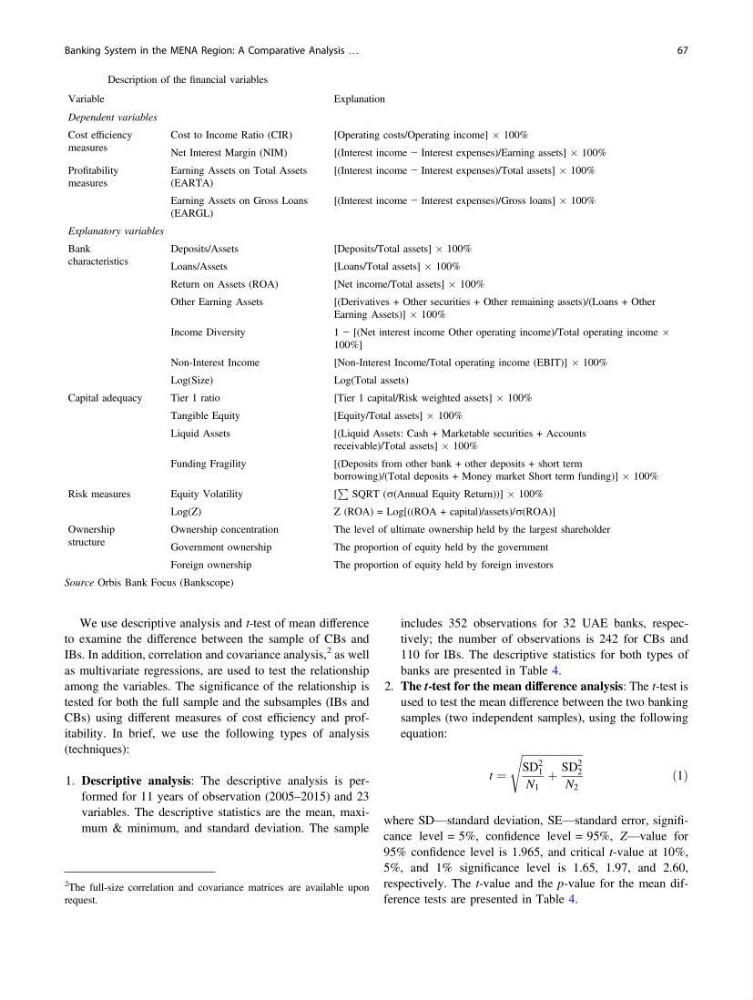
Table 3 Description of the financial variables
Variable
Explanation
Dependent variables
Cost efficiency
measures
Cost to Income Ratio (CIR)
[Operating costs/Operating income] Â 100%
Net Interest Margin (NIM)
[(Interest income − Interest expenses)/Earning assets] Â 100%
Profitability
measures
Earning Assets on Total Assets
(EARTA)
[(Interest income − Interest expenses)/Total assets] Â 100%
Earning Assets on Gross Loans
(EARGL)
[(Interest income − Interest expenses)/Gross loans] Â 100%
Explanatory variables
Bank
characteristics
Deposits/Assets
[Deposits/Total assets] Â 100%
Loans/Assets
[Loans/Total assets] Â 100%
Return on Assets (ROA)
[Net income/Total assets] Â 100%
Other Earning Assets
[(Derivatives + Other securities + Other remaining assets)/(Loans + Other
Earning Assets)] Â 100%
Income Diversity
1 − [(Net interest income Other operating income)/Total operating income Â
100%]
Non-Interest Income
[Non-Interest Income/Total operating income (EBIT)] Â 100%
Log(Size)
Log(Total assets)
Capital adequacy
Tier 1 ratio
[Tier 1 capital/Risk weighted assets] Â 100%
Tangible Equity
[Equity/Total assets] Â 100%
Liquid Assets
[(Liquid Assets: Cash + Marketable securities + Accounts
receivable)/Total assets] Â 100%
Funding Fragility
[(Deposits from other bank + other deposits + short term
borrowing)/(Total deposits + Money market Short term funding)] Â 100%
Risk measures
Equity Volatility
[
P
SQRT (r(Annual Equity Return))] Â 100%
Log(Z)
Z (ROA) = Log[((ROA + capital)/assets)/r(ROA)]
Ownership
structure
Ownership concentration
The level of ultimate ownership held by the largest shareholder
Government ownership
The proportion of equity held by the government
Foreign ownership
The proportion of equity held by foreign investors
Source Orbis Bank Focus (Bankscope)
2
The full-size correlation and covariance matrices are available upon
request.
Banking System in the MENA Region: A Comparative Analysis …
67
to examine the difference between the sample of CBs and
IBs. In addition, correlation and covariance analysis,
2 as well
as multivariate regressions, are used to test the relationship
among the variables. The significance of the relationship is
tested for both the full sample and the subsamples (IBs and
CBs) using different measures of cost efficiency and profitability. In brief, we use the following types of analysis
(techniques):
1. Descriptive analysis: The descriptive analysis is performed for 11 years of observation (2005–2015) and 23
variables. The descriptive statistics are the mean, maximum & minimum, and standard deviation. The sample
includes 352 observations for 32 UAE banks, respectively; the number of observations is 242 for CBs and
110 for IBs. The descriptive statistics for both types of
banks are presented in Table 4.
2. The t-test for the mean difference analysis: The t-test is
used to test the mean difference between the two banking
samples (two independent samples), using the following
equation:
t ¼
ffiffiffiffiffiffiffiffiffiffiffiffiffiffiffiffiffiffiffiffiffiffiffi
SD
2
1
N 1
þ
SD
2
2
N 2
s
ð1Þ
where SD—standard deviation, SE—standard error, significance level = 5%, confidence level = 95%, Z—value for
95% confidence level is 1.965, and critical t-value at 10%,
5%, and 1% significance level is 1.65, 1.97, and 2.60,
respectively. The t-value and the p-value for the mean difference tests are presented in Table 4.
Table 3 Description of the financial variables
Variable
Explanation
Dependent variables
Cost efficiency
measures
Cost to Income Ratio (CIR)
[Operating costs/Operating income] Â 100%
Net Interest Margin (NIM)
[(Interest income − Interest expenses)/Earning assets] Â 100%
Profitability
measures
Earning Assets on Total Assets
(EARTA)
[(Interest income − Interest expenses)/Total assets] Â 100%
Earning Assets on Gross Loans
(EARGL)
[(Interest income − Interest expenses)/Gross loans] Â 100%
Explanatory variables
Bank
characteristics
Deposits/Assets
[Deposits/Total assets] Â 100%
Loans/Assets
[Loans/Total assets] Â 100%
Return on Assets (ROA)
[Net income/Total assets] Â 100%
Other Earning Assets
[(Derivatives + Other securities + Other remaining assets)/(Loans + Other
Earning Assets)] Â 100%
Income Diversity
1 − [(Net interest income Other operating income)/Total operating income Â
100%]
Non-Interest Income
[Non-Interest Income/Total operating income (EBIT)] Â 100%
Log(Size)
Log(Total assets)
Capital adequacy
Tier 1 ratio
[Tier 1 capital/Risk weighted assets] Â 100%
Tangible Equity
[Equity/Total assets] Â 100%
Liquid Assets
[(Liquid Assets: Cash + Marketable securities + Accounts
receivable)/Total assets] Â 100%
Funding Fragility
[(Deposits from other bank + other deposits + short term
borrowing)/(Total deposits + Money market Short term funding)] Â 100%
Risk measures
Equity Volatility
[
P
SQRT (r(Annual Equity Return))] Â 100%
Log(Z)
Z (ROA) = Log[((ROA + capital)/assets)/r(ROA)]
Ownership
structure
Ownership concentration
The level of ultimate ownership held by the largest shareholder
Government ownership
The proportion of equity held by the government
Foreign ownership
The proportion of equity held by foreign investors
Source Orbis Bank Focus (Bankscope)
2
The full-size correlation and covariance matrices are available upon
request.
Banking System in the MENA Region: A Comparative Analysis …
67