

4 years (from 2004 to 2007) examined. The results in the
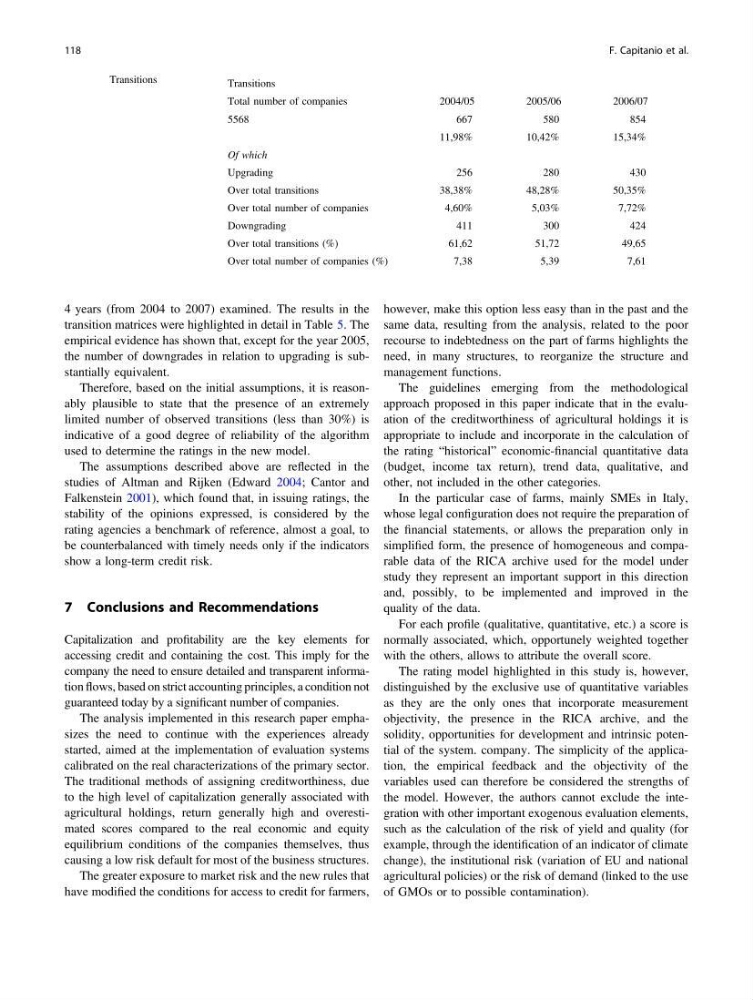
transition matrices were highlighted in detail in Table 5. The
empirical evidence has shown that, except for the year 2005,
the number of downgrades in relation to upgrading is substantially equivalent.
Therefore, based on the initial assumptions, it is reasonably plausible to state that the presence of an extremely
limited number of observed transitions (less than 30%) is
indicative of a good degree of reliability of the algorithm
used to determine the ratings in the new model.
The assumptions described above are reflected in the
studies of Altman and Rijken (Edward 2004; Cantor and
Falkenstein 2001), which found that, in issuing ratings, the
stability of the opinions expressed, is considered by the
rating agencies a benchmark of reference, almost a goal, to
be counterbalanced with timely needs only if the indicators
show a long-term credit risk.
7 Conclusions and Recommendations
Capitalization and profitability are the key elements for
accessing credit and containing the cost. This imply for the
company the need to ensure detailed and transparent information flows, based on strict accounting principles, a condition not
guaranteed today by a significant number of companies.
The analysis implemented in this research paper emphasizes the need to continue with the experiences already
started, aimed at the implementation of evaluation systems
calibrated on the real characterizations of the primary sector.
The traditional methods of assigning creditworthiness, due
to the high level of capitalization generally associated with
agricultural holdings, return generally high and overestimated scores compared to the real economic and equity
equilibrium conditions of the companies themselves, thus
causing a low risk default for most of the business structures.
The greater exposure to market risk and the new rules that
have modified the conditions for access to credit for farmers,
however, make this option less easy than in the past and the
same data, resulting from the analysis, related to the poor
recourse to indebtedness on the part of farms highlights the
need, in many structures, to reorganize the structure and
management functions.
The guidelines emerging from the methodological
approach proposed in this paper indicate that in the evaluation of the creditworthiness of agricultural holdings it is
appropriate to include and incorporate in the calculation of
the rating “historical” economic-financial quantitative data
(budget, income tax return), trend data, qualitative, and
other, not included in the other categories.
In the particular case of farms, mainly SMEs in Italy,
whose legal configuration does not require the preparation of
the financial statements, or allows the preparation only in
simplified form, the presence of homogeneous and comparable data of the RICA archive used for the model under
study they represent an important support in this direction
and, possibly, to be implemented and improved in the
quality of the data.
For each profile (qualitative, quantitative, etc.) a score is
normally associated, which, opportunely weighted together
with the others, allows to attribute the overall score.
The rating model highlighted in this study is, however,
distinguished by the exclusive use of quantitative variables
as they are the only ones that incorporate measurement
objectivity, the presence in the RICA archive, and the
solidity, opportunities for development and intrinsic potential of the system. company. The simplicity of the application, the empirical feedback and the objectivity of the
variables used can therefore be considered the strengths of
the model. However, the authors cannot exclude the integration with other important exogenous evaluation elements,
such as the calculation of the risk of yield and quality (for
example, through the identification of an indicator of climate
change), the institutional risk (variation of EU and national
agricultural policies) or the risk of demand (linked to the use
of GMOs or to possible contamination).
Table 5 Transitions
Transitions
Total number of companies
2004/05
2005/06
2006/07
5568
667
580
854
11,98%
10,42%
15,34%
Of which
Upgrading
256
280
430
Over total transitions
38,38%
48,28%
50,35%
Over total number of companies
4,60%
5,03%
7,72%
Downgrading
411
300
424
Over total transitions (%)
61,62
51,72
49,65
Over total number of companies (%)
7,38
5,39
7,61
118
F. Capitanio et al.
transition matrices were highlighted in detail in Table 5. The
empirical evidence has shown that, except for the year 2005,
the number of downgrades in relation to upgrading is substantially equivalent.
Therefore, based on the initial assumptions, it is reasonably plausible to state that the presence of an extremely
limited number of observed transitions (less than 30%) is
indicative of a good degree of reliability of the algorithm
used to determine the ratings in the new model.
The assumptions described above are reflected in the
studies of Altman and Rijken (Edward 2004; Cantor and
Falkenstein 2001), which found that, in issuing ratings, the
stability of the opinions expressed, is considered by the
rating agencies a benchmark of reference, almost a goal, to
be counterbalanced with timely needs only if the indicators
show a long-term credit risk.
7 Conclusions and Recommendations
Capitalization and profitability are the key elements for
accessing credit and containing the cost. This imply for the
company the need to ensure detailed and transparent information flows, based on strict accounting principles, a condition not
guaranteed today by a significant number of companies.
The analysis implemented in this research paper emphasizes the need to continue with the experiences already
started, aimed at the implementation of evaluation systems
calibrated on the real characterizations of the primary sector.
The traditional methods of assigning creditworthiness, due
to the high level of capitalization generally associated with
agricultural holdings, return generally high and overestimated scores compared to the real economic and equity
equilibrium conditions of the companies themselves, thus
causing a low risk default for most of the business structures.
The greater exposure to market risk and the new rules that
have modified the conditions for access to credit for farmers,
however, make this option less easy than in the past and the
same data, resulting from the analysis, related to the poor
recourse to indebtedness on the part of farms highlights the
need, in many structures, to reorganize the structure and
management functions.
The guidelines emerging from the methodological
approach proposed in this paper indicate that in the evaluation of the creditworthiness of agricultural holdings it is
appropriate to include and incorporate in the calculation of
the rating “historical” economic-financial quantitative data
(budget, income tax return), trend data, qualitative, and
other, not included in the other categories.
In the particular case of farms, mainly SMEs in Italy,
whose legal configuration does not require the preparation of
the financial statements, or allows the preparation only in
simplified form, the presence of homogeneous and comparable data of the RICA archive used for the model under
study they represent an important support in this direction
and, possibly, to be implemented and improved in the
quality of the data.
For each profile (qualitative, quantitative, etc.) a score is
normally associated, which, opportunely weighted together
with the others, allows to attribute the overall score.
The rating model highlighted in this study is, however,
distinguished by the exclusive use of quantitative variables
as they are the only ones that incorporate measurement
objectivity, the presence in the RICA archive, and the
solidity, opportunities for development and intrinsic potential of the system. company. The simplicity of the application, the empirical feedback and the objectivity of the
variables used can therefore be considered the strengths of
the model. However, the authors cannot exclude the integration with other important exogenous evaluation elements,
such as the calculation of the risk of yield and quality (for
example, through the identification of an indicator of climate
change), the institutional risk (variation of EU and national
agricultural policies) or the risk of demand (linked to the use
of GMOs or to possible contamination).
Table 5 Transitions
Transitions
Total number of companies
2004/05
2005/06
2006/07
5568
667
580
854
11,98%
10,42%
15,34%
Of which
Upgrading
256
280
430
Over total transitions
38,38%
48,28%
50,35%
Over total number of companies
4,60%
5,03%
7,72%
Downgrading
411
300
424
Over total transitions (%)
61,62
51,72
49,65
Over total number of companies (%)
7,38
5,39
7,61
118
F. Capitanio et al.