

4.2 Experimental Setup and Methods
49
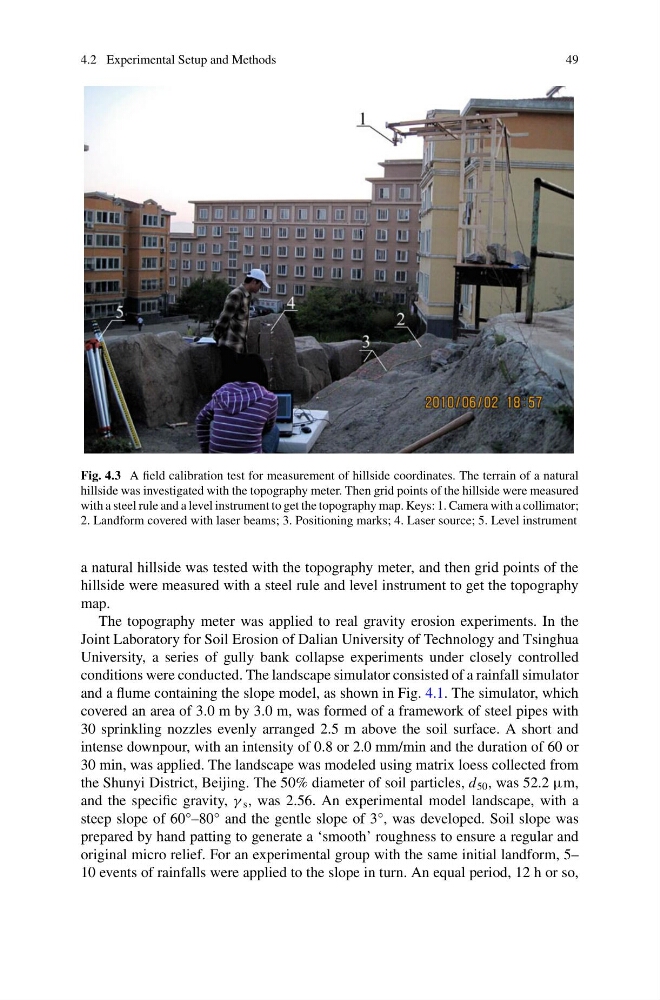
Fig. 4.3 A field calibration test for measurement of hillside coordinates. The terrain of a natural
hillside was investigated with the topography meter. Then grid points of the hillside were measured
with a steel rule and a level instrument to get the topography map. Keys: 1. Camera with a collimator;
2. Landform covered with laser beams; 3. Positioning marks; 4. Laser source; 5. Level instrument
a natural hillside was tested with the topography meter, and then grid points of the
hillside were measured with a steel rule and level instrument to get the topography
map.
The topography meter was applied to real gravity erosion experiments. In the
Joint Laboratory for Soil Erosion of Dalian University of Technology and Tsinghua
University, a series of gully bank collapse experiments under closely controlled
conditions were conducted. The landscape simulator consisted of a rainfall simulator
and a flume containing the slope model, as shown in Fig. 4.1. The simulator, which
covered an area of 3.0 m by 3.0 m, was formed of a framework of steel pipes with
30 sprinkling nozzles evenly arranged 2.5 m above the soil surface. A short and
intense downpour, with an intensity of 0.8 or 2.0 mm/min and the duration of 60 or
30 min, was applied. The landscape was modeled using matrix loess collected from
the Shunyi District, Beijing. The 50% diameter of soil particles, d 50 , was 52.2 µm,
and the specific gravity, γ s , was 2.56. An experimental model landscape, with a
steep slope of 60°–80° and the gentle slope of 3°, was developed. Soil slope was
prepared by hand patting to generate a ‘smooth’ roughness to ensure a regular and
original micro relief. For an experimental group with the same initial landform, 5–
10 events of rainfalls were applied to the slope in turn. An equal period, 12 h or so,
49
Fig. 4.3 A field calibration test for measurement of hillside coordinates. The terrain of a natural
hillside was investigated with the topography meter. Then grid points of the hillside were measured
with a steel rule and a level instrument to get the topography map. Keys: 1. Camera with a collimator;
2. Landform covered with laser beams; 3. Positioning marks; 4. Laser source; 5. Level instrument
a natural hillside was tested with the topography meter, and then grid points of the
hillside were measured with a steel rule and level instrument to get the topography
map.
The topography meter was applied to real gravity erosion experiments. In the
Joint Laboratory for Soil Erosion of Dalian University of Technology and Tsinghua
University, a series of gully bank collapse experiments under closely controlled
conditions were conducted. The landscape simulator consisted of a rainfall simulator
and a flume containing the slope model, as shown in Fig. 4.1. The simulator, which
covered an area of 3.0 m by 3.0 m, was formed of a framework of steel pipes with
30 sprinkling nozzles evenly arranged 2.5 m above the soil surface. A short and
intense downpour, with an intensity of 0.8 or 2.0 mm/min and the duration of 60 or
30 min, was applied. The landscape was modeled using matrix loess collected from
the Shunyi District, Beijing. The 50% diameter of soil particles, d 50 , was 52.2 µm,
and the specific gravity, γ s , was 2.56. An experimental model landscape, with a
steep slope of 60°–80° and the gentle slope of 3°, was developed. Soil slope was
prepared by hand patting to generate a ‘smooth’ roughness to ensure a regular and
original micro relief. For an experimental group with the same initial landform, 5–
10 events of rainfalls were applied to the slope in turn. An equal period, 12 h or so,