

4.1 Quantitative Monitoring of Gravity Erosion
47
impossible, because we are unable to predict when and where the gravity erosion will
occur. Hence, what we could do is to simulate the landslide processes by employing a
conceptual slope under rainfall simulation. However, the representative catchments
on the Chinese Loess Plateau for scientific research are generally far from urban
areas, lack water and electricity, and have deep ditches, steep slopes, inconvenient
transportation, and high-strength winds. The special situation poses another severe
challenge to the site survey. Here, we designed a removable house that could be
assembled in the field to conduct site-specific tests based on the terrain of the Loess
Plateau. The room provided the same conditions for simulations and observations as
those in the laboratory. We also presented a detailed illustration of the MX-2010-G
topography meter to dynamically monitor the slope behavior under rainfall simulation. The design optimization and fabrication methods of the topography meter and
the laboratory would be expected to be useful for congeneric device applications.
4.2 Experimental Setup and Methods
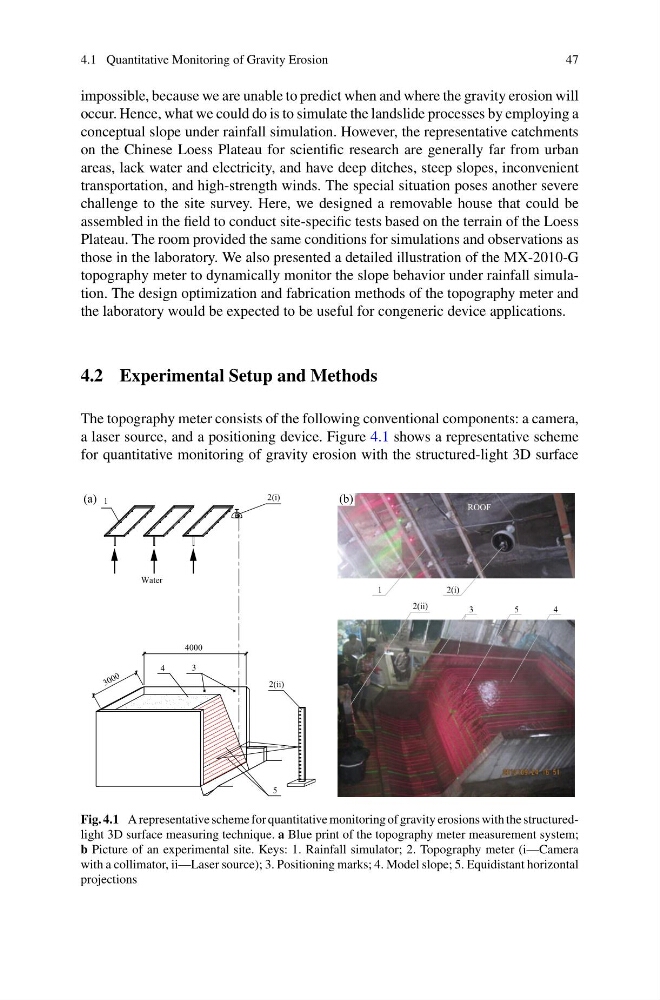
The topography meter consists of the following conventional components: a camera,
a laser source, and a positioning device. Figure 4.1 shows a representative scheme
for quantitative monitoring of gravity erosion with the structured-light 3D surface
5
4
3
4000
3 0 0 0
1
2(i)
2(i)
2(ii)
2(ii)
Water
ROOF
1
3
5
4
(a)
(b)
Fig. 4.1 A representative scheme for quantitative monitoring of gravity erosions with the structuredlight 3D surface measuring technique. a Blue print of the topography meter measurement system;
b Picture of an experimental site. Keys: 1. Rainfall simulator; 2. Topography meter (i—Camera
with a collimator, ii—Laser source); 3. Positioning marks; 4. Model slope; 5. Equidistant horizontal
projections
47
impossible, because we are unable to predict when and where the gravity erosion will
occur. Hence, what we could do is to simulate the landslide processes by employing a
conceptual slope under rainfall simulation. However, the representative catchments
on the Chinese Loess Plateau for scientific research are generally far from urban
areas, lack water and electricity, and have deep ditches, steep slopes, inconvenient
transportation, and high-strength winds. The special situation poses another severe
challenge to the site survey. Here, we designed a removable house that could be
assembled in the field to conduct site-specific tests based on the terrain of the Loess
Plateau. The room provided the same conditions for simulations and observations as
those in the laboratory. We also presented a detailed illustration of the MX-2010-G
topography meter to dynamically monitor the slope behavior under rainfall simulation. The design optimization and fabrication methods of the topography meter and
the laboratory would be expected to be useful for congeneric device applications.
4.2 Experimental Setup and Methods
The topography meter consists of the following conventional components: a camera,
a laser source, and a positioning device. Figure 4.1 shows a representative scheme
for quantitative monitoring of gravity erosion with the structured-light 3D surface
5
4
3
4000
3 0 0 0
1
2(i)
2(i)
2(ii)
2(ii)
Water
ROOF
1
3
5
4
(a)
(b)
Fig. 4.1 A representative scheme for quantitative monitoring of gravity erosions with the structuredlight 3D surface measuring technique. a Blue print of the topography meter measurement system;
b Picture of an experimental site. Keys: 1. Rainfall simulator; 2. Topography meter (i—Camera
with a collimator, ii—Laser source); 3. Positioning marks; 4. Model slope; 5. Equidistant horizontal
projections