

216
13 Tunnel Flow and Erosion Processes …
0
100
200
I (mm/h)
Rainfall
0
200
400
600
800
1000
0
50
100
150
200
250
Sc (g/l)
Q (l/s)
Tunnel 1
Flow discharge
Sediment concentration
Flow discharge
Sediment concentration
Flow discharge
Sediment concentration
Flow discharge
Sediment concentration
Flow discharge
Sediment concentration
0
200
400
600
800
1000
0
50
100
150
200
250
Sc (g/l)
Q (l/s)
Tunnel 3
0
200
400
600
800
1000
0
50
100
150
200
250
Sc (g/l)
Q (l/s)
Tunnel 4
0
200
400
600
800
1000
0
50
100
150
200
250
Sc (g/l)
Q (l/s)
Tunnel 6
0
200
400
600
800
1000
0
100
200
300
400
500
600
0
Sc (g/l)
Q (l/s)
Time (h)
Sub-basin
0.5
1
2
1.5
2.5
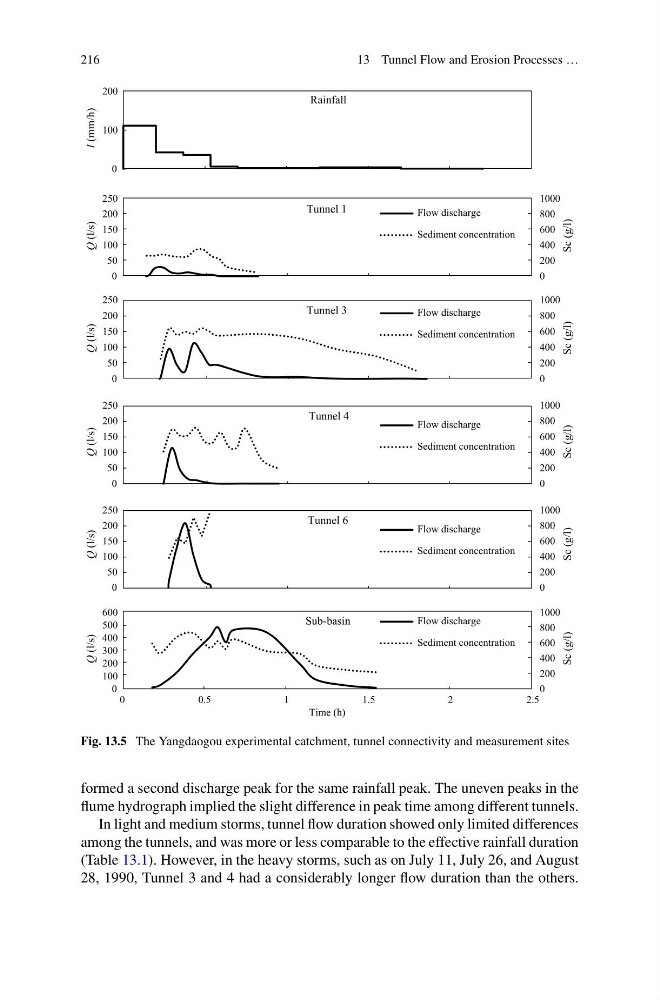
Fig. 13.5 The Yangdaogou experimental catchment, tunnel connectivity and measurement sites
formed a second discharge peak for the same rainfall peak. The uneven peaks in the
flume hydrograph implied the slight difference in peak time among different tunnels.
In light and medium storms, tunnel flow duration showed only limited differences
among the tunnels, and was more or less comparable to the effective rainfall duration
(Table 13.1). However, in the heavy storms, such as on July 11, July 26, and August
28, 1990, Tunnel 3 and 4 had a considerably longer flow duration than the others.
13 Tunnel Flow and Erosion Processes …
0
100
200
I (mm/h)
Rainfall
0
200
400
600
800
1000
0
50
100
150
200
250
Sc (g/l)
Q (l/s)
Tunnel 1
Flow discharge
Sediment concentration
Flow discharge
Sediment concentration
Flow discharge
Sediment concentration
Flow discharge
Sediment concentration
Flow discharge
Sediment concentration
0
200
400
600
800
1000
0
50
100
150
200
250
Sc (g/l)
Q (l/s)
Tunnel 3
0
200
400
600
800
1000
0
50
100
150
200
250
Sc (g/l)
Q (l/s)
Tunnel 4
0
200
400
600
800
1000
0
50
100
150
200
250
Sc (g/l)
Q (l/s)
Tunnel 6
0
200
400
600
800
1000
0
100
200
300
400
500
600
0
Sc (g/l)
Q (l/s)
Time (h)
Sub-basin
0.5
1
2
1.5
2.5
Fig. 13.5 The Yangdaogou experimental catchment, tunnel connectivity and measurement sites
formed a second discharge peak for the same rainfall peak. The uneven peaks in the
flume hydrograph implied the slight difference in peak time among different tunnels.
In light and medium storms, tunnel flow duration showed only limited differences
among the tunnels, and was more or less comparable to the effective rainfall duration
(Table 13.1). However, in the heavy storms, such as on July 11, July 26, and August
28, 1990, Tunnel 3 and 4 had a considerably longer flow duration than the others.