

200
12 Effects of Gravity Erosion on Particle Size Distribution …
study were within the expected range from 0 to 3 (Turcotte 1986). The D values
of the suspended sediments ranged from 2.60 to 2.78, which were all higher than
those of the undisturbed slope soils, with an average value of 2.48. As shown in
Fig. 12.3c, there was a significant difference in D among different types of soil
erosion. D increased from 2.60 to 2.78 for the gully flows as gravity erosion occurred.
This implies that mass failures could make the PSDSS more irregular, because the
proportions of silt and clay particles were increased and the proportion of sand-sized
particles was decreased, which led to an increase in the D values (Gao et al. 2014;
Wang et al. 2010). Nevertheless, the D values of the suspended sediments in the
channel flows before and after mass failures were quite close (2.74 vs. 2.76). The
results demonstrate that D could be one of the effective indexes to reflect the physical
properties of the suspended sediment by different soil erosion processes.
12.4.3 Changes of Enrichment/Dilution Ratios by Water
Erosion and Gravity Erosion
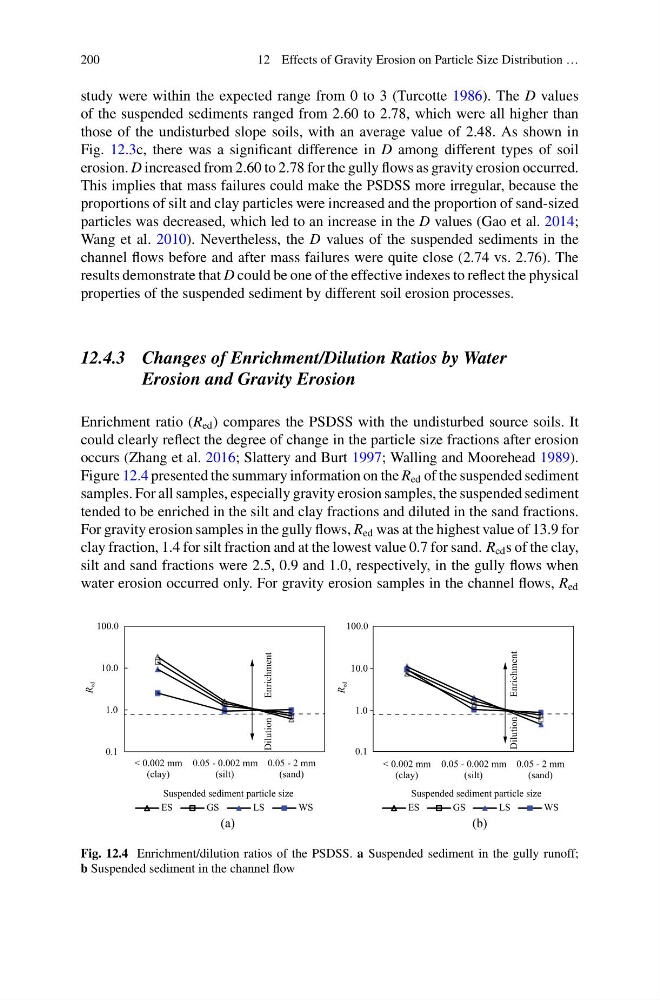
Enrichment ratio (R ed ) compares the PSDSS with the undisturbed source soils. It
could clearly reflect the degree of change in the particle size fractions after erosion
occurs (Zhang et al. 2016; Slattery and Burt 1997; Walling and Moorehead 1989).
Figure 12.4 presented the summary information on the R ed of the suspended sediment
samples. For all samples, especially gravity erosion samples, the suspended sediment
tended to be enriched in the silt and clay fractions and diluted in the sand fractions.
For gravity erosion samples in the gully flows, R ed was at the highest value of 13.9 for
clay fraction, 1.4 for silt fraction and at the lowest value 0.7 for sand. R ed s of the clay,
silt and sand fractions were 2.5, 0.9 and 1.0, respectively, in the gully flows when
water erosion occurred only. For gravity erosion samples in the channel flows, R ed
0.1
1.0
10.0
100.0
< 0.002 mm
(clay)
0.05 - 0.002 mm
(silt)
0.05 - 2 mm
(sand)
R
ed
Suspended sediment particle size
ES
GS
LS
WS
Dilution
Enrichment
0.1
1.0
10.0
100.0
< 0.002 mm
(clay)
0.05 - 0.002 mm
(silt)
0.05 - 2 mm
(sand)
R
ed
Suspended sediment particle size
ES
GS
LS
WS
Dilution
Enrichment
(a)
(b)
Fig. 12.4 Enrichment/dilution ratios of the PSDSS. a Suspended sediment in the gully runoff;
b Suspended sediment in the channel flow
12 Effects of Gravity Erosion on Particle Size Distribution …
study were within the expected range from 0 to 3 (Turcotte 1986). The D values
of the suspended sediments ranged from 2.60 to 2.78, which were all higher than
those of the undisturbed slope soils, with an average value of 2.48. As shown in
Fig. 12.3c, there was a significant difference in D among different types of soil
erosion. D increased from 2.60 to 2.78 for the gully flows as gravity erosion occurred.
This implies that mass failures could make the PSDSS more irregular, because the
proportions of silt and clay particles were increased and the proportion of sand-sized
particles was decreased, which led to an increase in the D values (Gao et al. 2014;
Wang et al. 2010). Nevertheless, the D values of the suspended sediments in the
channel flows before and after mass failures were quite close (2.74 vs. 2.76). The
results demonstrate that D could be one of the effective indexes to reflect the physical
properties of the suspended sediment by different soil erosion processes.
12.4.3 Changes of Enrichment/Dilution Ratios by Water
Erosion and Gravity Erosion
Enrichment ratio (R ed ) compares the PSDSS with the undisturbed source soils. It
could clearly reflect the degree of change in the particle size fractions after erosion
occurs (Zhang et al. 2016; Slattery and Burt 1997; Walling and Moorehead 1989).
Figure 12.4 presented the summary information on the R ed of the suspended sediment
samples. For all samples, especially gravity erosion samples, the suspended sediment
tended to be enriched in the silt and clay fractions and diluted in the sand fractions.
For gravity erosion samples in the gully flows, R ed was at the highest value of 13.9 for
clay fraction, 1.4 for silt fraction and at the lowest value 0.7 for sand. R ed s of the clay,
silt and sand fractions were 2.5, 0.9 and 1.0, respectively, in the gully flows when
water erosion occurred only. For gravity erosion samples in the channel flows, R ed
0.1
1.0
10.0
100.0
< 0.002 mm
(clay)
0.05 - 0.002 mm
(silt)
0.05 - 2 mm
(sand)
R
ed
Suspended sediment particle size
ES
GS
LS
WS
Dilution
Enrichment
0.1
1.0
10.0
100.0
< 0.002 mm
(clay)
0.05 - 0.002 mm
(silt)
0.05 - 2 mm
(sand)
R
ed
Suspended sediment particle size
ES
GS
LS
WS
Dilution
Enrichment
(a)
(b)
Fig. 12.4 Enrichment/dilution ratios of the PSDSS. a Suspended sediment in the gully runoff;
b Suspended sediment in the channel flow