

11.3 Results and Discussion
177
(a)
(b)
(c)
(d)
60%
10%
30%
Tf
Dc
Uc
Ia
Ps
Co
78%
5%
17%
Tf
Dc
Uc
Ia
Ps
Co
45%
26%
23%
3%
2%
1%
Tf
Dc
Uc
Ia
Ps
Co
58%
16%
20%
2%
3%
1%
Tf
Dc
Uc
Ia
Ps
Co
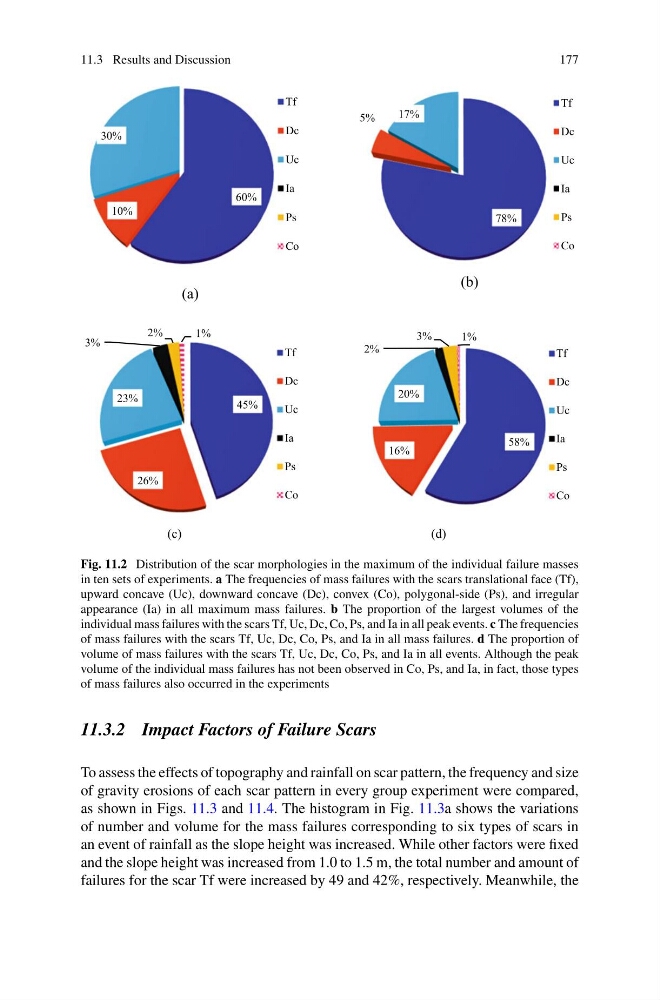
Fig. 11.2 Distribution of the scar morphologies in the maximum of the individual failure masses
in ten sets of experiments. a The frequencies of mass failures with the scars translational face (Tf),
upward concave (Uc), downward concave (Dc), convex (Co), polygonal-side (Ps), and irregular
appearance (Ia) in all maximum mass failures. b The proportion of the largest volumes of the
individual mass failures with the scars Tf, Uc, Dc, Co, Ps, and Ia in all peak events. c The frequencies
of mass failures with the scars Tf, Uc, Dc, Co, Ps, and Ia in all mass failures. d The proportion of
volume of mass failures with the scars Tf, Uc, Dc, Co, Ps, and Ia in all events. Although the peak
volume of the individual mass failures has not been observed in Co, Ps, and Ia, in fact, those types
of mass failures also occurred in the experiments
11.3.2 Impact Factors of Failure Scars
To assess the effects of topography and rainfall on scar pattern, the frequency and size
of gravity erosions of each scar pattern in every group experiment were compared,
as shown in Figs. 11.3 and 11.4. The histogram in Fig. 11.3a shows the variations
of number and volume for the mass failures corresponding to six types of scars in
an event of rainfall as the slope height was increased. While other factors were fixed
and the slope height was increased from 1.0 to 1.5 m, the total number and amount of
failures for the scar Tf were increased by 49 and 42%, respectively. Meanwhile, the
177
(a)
(b)
(c)
(d)
60%
10%
30%
Tf
Dc
Uc
Ia
Ps
Co
78%
5%
17%
Tf
Dc
Uc
Ia
Ps
Co
45%
26%
23%
3%
2%
1%
Tf
Dc
Uc
Ia
Ps
Co
58%
16%
20%
2%
3%
1%
Tf
Dc
Uc
Ia
Ps
Co
Fig. 11.2 Distribution of the scar morphologies in the maximum of the individual failure masses
in ten sets of experiments. a The frequencies of mass failures with the scars translational face (Tf),
upward concave (Uc), downward concave (Dc), convex (Co), polygonal-side (Ps), and irregular
appearance (Ia) in all maximum mass failures. b The proportion of the largest volumes of the
individual mass failures with the scars Tf, Uc, Dc, Co, Ps, and Ia in all peak events. c The frequencies
of mass failures with the scars Tf, Uc, Dc, Co, Ps, and Ia in all mass failures. d The proportion of
volume of mass failures with the scars Tf, Uc, Dc, Co, Ps, and Ia in all events. Although the peak
volume of the individual mass failures has not been observed in Co, Ps, and Ia, in fact, those types
of mass failures also occurred in the experiments
11.3.2 Impact Factors of Failure Scars
To assess the effects of topography and rainfall on scar pattern, the frequency and size
of gravity erosions of each scar pattern in every group experiment were compared,
as shown in Figs. 11.3 and 11.4. The histogram in Fig. 11.3a shows the variations
of number and volume for the mass failures corresponding to six types of scars in
an event of rainfall as the slope height was increased. While other factors were fixed
and the slope height was increased from 1.0 to 1.5 m, the total number and amount of
failures for the scar Tf were increased by 49 and 42%, respectively. Meanwhile, the