

10.3 Experimental Methods
153
(a)
(b)
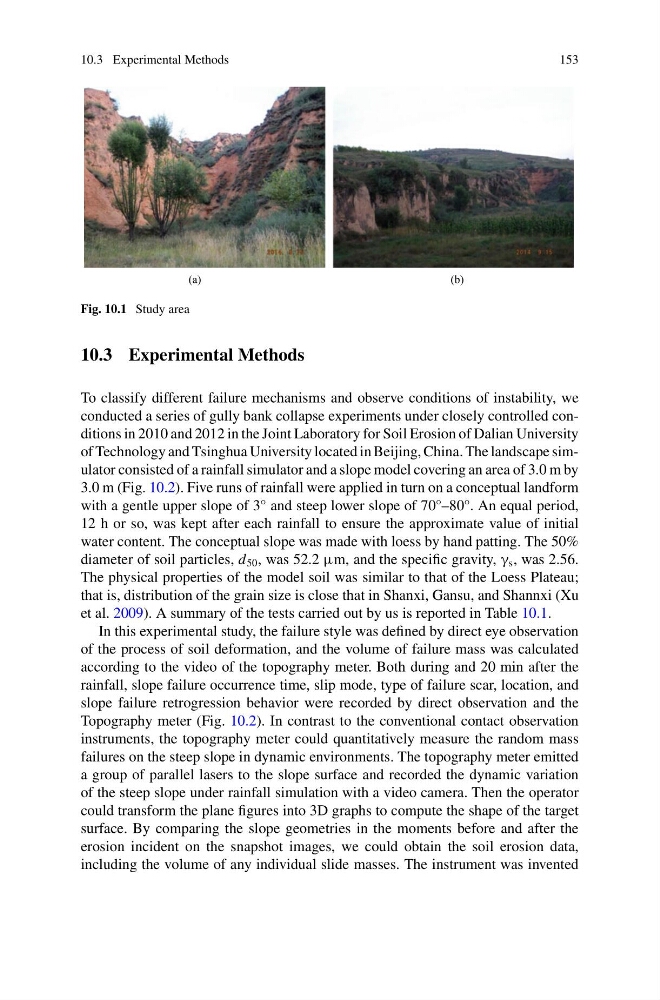
Fig. 10.1 Study area
10.3 Experimental Methods
To classify different failure mechanisms and observe conditions of instability, we
conducted a series of gully bank collapse experiments under closely controlled conditions in 2010 and 2012 in the Joint Laboratory for Soil Erosion of Dalian University
of Technology and Tsinghua University located in Beijing, China. The landscape simulator consisted of a rainfall simulator and a slope model covering an area of 3.0 m by
3.0 m (Fig. 10.2). Five runs of rainfall were applied in turn on a conceptual landform
with a gentle upper slope of 3° and steep lower slope of 70°–80°. An equal period,
12 h or so, was kept after each rainfall to ensure the approximate value of initial
water content. The conceptual slope was made with loess by hand patting. The 50%
diameter of soil particles, d 50 , was 52.2 μm, and the specific gravity, γ s , was 2.56.
The physical properties of the model soil was similar to that of the Loess Plateau;
that is, distribution of the grain size is close that in Shanxi, Gansu, and Shannxi (Xu
et al. 2009). A summary of the tests carried out by us is reported in Table 10.1.
In this experimental study, the failure style was defined by direct eye observation
of the process of soil deformation, and the volume of failure mass was calculated
according to the video of the topography meter. Both during and 20 min after the
rainfall, slope failure occurrence time, slip mode, type of failure scar, location, and
slope failure retrogression behavior were recorded by direct observation and the
Topography meter (Fig. 10.2). In contrast to the conventional contact observation
instruments, the topography meter could quantitatively measure the random mass
failures on the steep slope in dynamic environments. The topography meter emitted
a group of parallel lasers to the slope surface and recorded the dynamic variation
of the steep slope under rainfall simulation with a video camera. Then the operator
could transform the plane figures into 3D graphs to compute the shape of the target
surface. By comparing the slope geometries in the moments before and after the
erosion incident on the snapshot images, we could obtain the soil erosion data,
including the volume of any individual slide masses. The instrument was invented
153
(a)
(b)
Fig. 10.1 Study area
10.3 Experimental Methods
To classify different failure mechanisms and observe conditions of instability, we
conducted a series of gully bank collapse experiments under closely controlled conditions in 2010 and 2012 in the Joint Laboratory for Soil Erosion of Dalian University
of Technology and Tsinghua University located in Beijing, China. The landscape simulator consisted of a rainfall simulator and a slope model covering an area of 3.0 m by
3.0 m (Fig. 10.2). Five runs of rainfall were applied in turn on a conceptual landform
with a gentle upper slope of 3° and steep lower slope of 70°–80°. An equal period,
12 h or so, was kept after each rainfall to ensure the approximate value of initial
water content. The conceptual slope was made with loess by hand patting. The 50%
diameter of soil particles, d 50 , was 52.2 μm, and the specific gravity, γ s , was 2.56.
The physical properties of the model soil was similar to that of the Loess Plateau;
that is, distribution of the grain size is close that in Shanxi, Gansu, and Shannxi (Xu
et al. 2009). A summary of the tests carried out by us is reported in Table 10.1.
In this experimental study, the failure style was defined by direct eye observation
of the process of soil deformation, and the volume of failure mass was calculated
according to the video of the topography meter. Both during and 20 min after the
rainfall, slope failure occurrence time, slip mode, type of failure scar, location, and
slope failure retrogression behavior were recorded by direct observation and the
Topography meter (Fig. 10.2). In contrast to the conventional contact observation
instruments, the topography meter could quantitatively measure the random mass
failures on the steep slope in dynamic environments. The topography meter emitted
a group of parallel lasers to the slope surface and recorded the dynamic variation
of the steep slope under rainfall simulation with a video camera. Then the operator
could transform the plane figures into 3D graphs to compute the shape of the target
surface. By comparing the slope geometries in the moments before and after the
erosion incident on the snapshot images, we could obtain the soil erosion data,
including the volume of any individual slide masses. The instrument was invented