

8.3 Experimental Methods
123
The sprinkling intensity could be adjusted by pressure valves to maintain a constant
hydraulic head for all nozzles which were located at different elevations. Each basic
unit watered a circular area of approximate 5 m in diameter. Two lines of five units
each were used to simulate rainfalls in the experimental spot of 6 m by 10.8 m.
Clean water was pumped from the nearby reservoir to a constant head tank, and
then pumped to the rainfall simulators. A flow-meter and a cut-off valve for each
rainfall unit were used to adjust manually the delivery rate of the immersed pump
to achieve the desired rainfall intensity. Distribution uniformity of the rainfall was
determined using rain-gauges equidistantly spaced over the landscape surface and
was measured for three separate periods of ten minutes prior to the experiments. The
spatial distribution of the rainfall intensities for the simulator was not uniform, but
was constant with time, and was comparable to the sprinkler delivery systems used
by others (e.g. Zhou et al. 2000), especially when the rainfall intensity was in the
range of 1.0–2.5 mm/min. Drops with an average diameter of about 1.2–2.0 mm,
which were measured by catching the drops on a sheet of absorbent paper, were
produced by the rainfall simulator (Xu et al. 2004b).
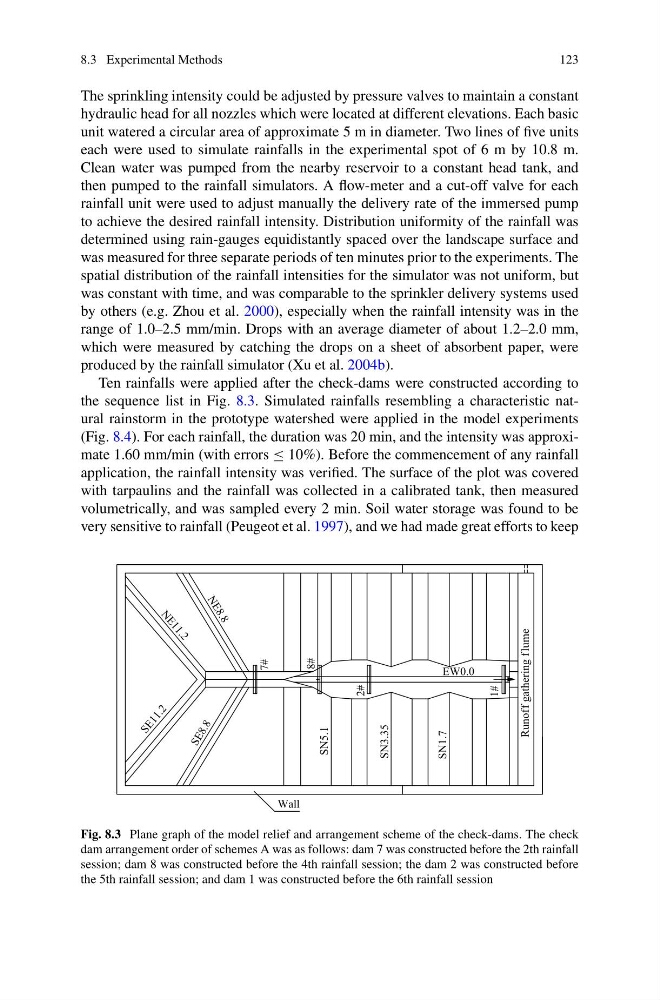
Ten rainfalls were applied after the check-dams were constructed according to
the sequence list in Fig. 8.3. Simulated rainfalls resembling a characteristic natural rainstorm in the prototype watershed were applied in the model experiments
(Fig. 8.4). For each rainfall, the duration was 20 min, and the intensity was approximate 1.60 mm/min (with errors ≤ 10%). Before the commencement of any rainfall
application, the rainfall intensity was verified. The surface of the plot was covered
with tarpaulins and the rainfall was collected in a calibrated tank, then measured
volumetrically, and was sampled every 2 min. Soil water storage was found to be
very sensitive to rainfall (Peugeot et al. 1997), and we had made great efforts to keep
SN3.35
S E 8 . 8
S E 1 1 . 2
N
E
1
1
.
2
Wall
N
E
8
.
8
7#
SN5.1
8#
2#
SN1.7
EW0.0
Runoff gathering f lume
1#
Fig. 8.3 Plane graph of the model relief and arrangement scheme of the check-dams. The check
dam arrangement order of schemes A was as follows: dam 7 was constructed before the 2th rainfall
session; dam 8 was constructed before the 4th rainfall session; the dam 2 was constructed before
the 5th rainfall session; and dam 1 was constructed before the 6th rainfall session
123
The sprinkling intensity could be adjusted by pressure valves to maintain a constant
hydraulic head for all nozzles which were located at different elevations. Each basic
unit watered a circular area of approximate 5 m in diameter. Two lines of five units
each were used to simulate rainfalls in the experimental spot of 6 m by 10.8 m.
Clean water was pumped from the nearby reservoir to a constant head tank, and
then pumped to the rainfall simulators. A flow-meter and a cut-off valve for each
rainfall unit were used to adjust manually the delivery rate of the immersed pump
to achieve the desired rainfall intensity. Distribution uniformity of the rainfall was
determined using rain-gauges equidistantly spaced over the landscape surface and
was measured for three separate periods of ten minutes prior to the experiments. The
spatial distribution of the rainfall intensities for the simulator was not uniform, but
was constant with time, and was comparable to the sprinkler delivery systems used
by others (e.g. Zhou et al. 2000), especially when the rainfall intensity was in the
range of 1.0–2.5 mm/min. Drops with an average diameter of about 1.2–2.0 mm,
which were measured by catching the drops on a sheet of absorbent paper, were
produced by the rainfall simulator (Xu et al. 2004b).
Ten rainfalls were applied after the check-dams were constructed according to
the sequence list in Fig. 8.3. Simulated rainfalls resembling a characteristic natural rainstorm in the prototype watershed were applied in the model experiments
(Fig. 8.4). For each rainfall, the duration was 20 min, and the intensity was approximate 1.60 mm/min (with errors ≤ 10%). Before the commencement of any rainfall
application, the rainfall intensity was verified. The surface of the plot was covered
with tarpaulins and the rainfall was collected in a calibrated tank, then measured
volumetrically, and was sampled every 2 min. Soil water storage was found to be
very sensitive to rainfall (Peugeot et al. 1997), and we had made great efforts to keep
SN3.35
S E 8 . 8
S E 1 1 . 2
N
E
1
1
.
2
Wall
N
E
8
.
8
7#
SN5.1
8#
2#
SN1.7
EW0.0
Runoff gathering f lume
1#
Fig. 8.3 Plane graph of the model relief and arrangement scheme of the check-dams. The check
dam arrangement order of schemes A was as follows: dam 7 was constructed before the 2th rainfall
session; dam 8 was constructed before the 4th rainfall session; the dam 2 was constructed before
the 5th rainfall session; and dam 1 was constructed before the 6th rainfall session