

8.3 Experimental Methods
121
Table 8.1 shows the experimental parameters for the runoff simulation experiments. The experimental system was made up of a water circuit and a gully model,
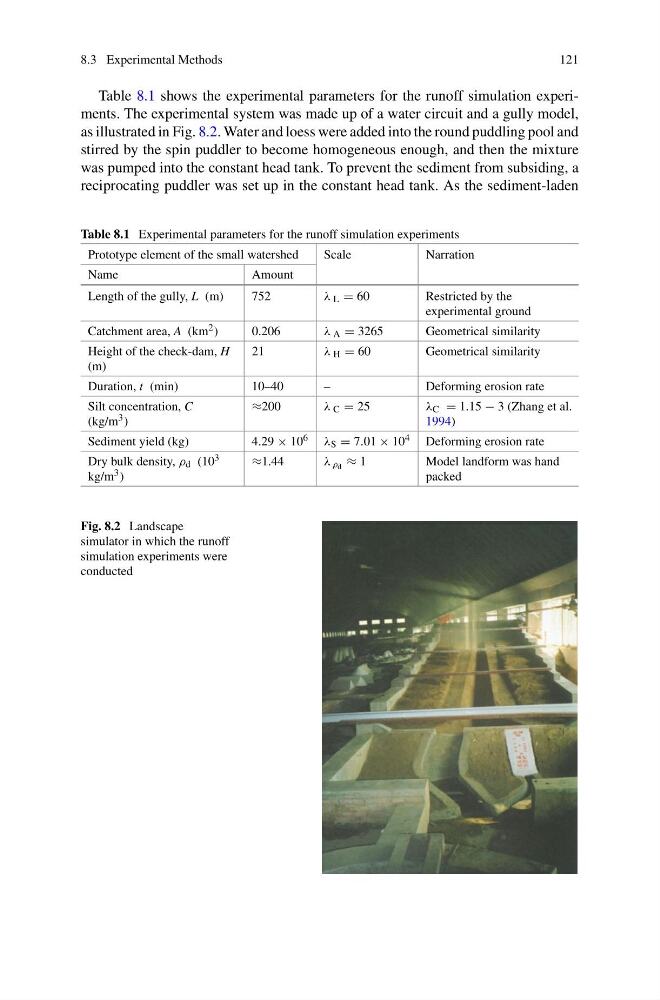
as illustrated in Fig. 8.2. Water and loess were added into the round puddling pool and
stirred by the spin puddler to become homogeneous enough, and then the mixture
was pumped into the constant head tank. To prevent the sediment from subsiding, a
reciprocating puddler was set up in the constant head tank. As the sediment-laden
Table 8.1 Experimental parameters for the runoff simulation experiments
Prototype element of the small watershed
Scale
Narration
Name
Amount
Length of the gully, L (m)
752
λ L = 60
Restricted by the
experimental ground
Catchment area, A (km 2 )
0.206
λ A = 3265
Geometrical similarity
Height of the check-dam, H
(m)
21
λ H = 60
Geometrical similarity
Duration, t (min)
10–40
–
Deforming erosion rate
Silt concentration, C
(kg/m 3 )
≈200
λ C = 25
λ C = 1.15 − 3 (Zhang et al.
1994)
Sediment yield (kg)
4.29 × 10 6 λ S = 7.01 × 10 4 Deforming erosion rate
Dry bulk density, ρ d (10 3
kg/m 3 )
≈1.44
λ ρd ≈ 1
Model landform was hand
packed
Fig. 8.2 Landscape
simulator in which the runoff
simulation experiments were
conducted
121
Table 8.1 shows the experimental parameters for the runoff simulation experiments. The experimental system was made up of a water circuit and a gully model,
as illustrated in Fig. 8.2. Water and loess were added into the round puddling pool and
stirred by the spin puddler to become homogeneous enough, and then the mixture
was pumped into the constant head tank. To prevent the sediment from subsiding, a
reciprocating puddler was set up in the constant head tank. As the sediment-laden
Table 8.1 Experimental parameters for the runoff simulation experiments
Prototype element of the small watershed
Scale
Narration
Name
Amount
Length of the gully, L (m)
752
λ L = 60
Restricted by the
experimental ground
Catchment area, A (km 2 )
0.206
λ A = 3265
Geometrical similarity
Height of the check-dam, H
(m)
21
λ H = 60
Geometrical similarity
Duration, t (min)
10–40
–
Deforming erosion rate
Silt concentration, C
(kg/m 3 )
≈200
λ C = 25
λ C = 1.15 − 3 (Zhang et al.
1994)
Sediment yield (kg)
4.29 × 10 6 λ S = 7.01 × 10 4 Deforming erosion rate
Dry bulk density, ρ d (10 3
kg/m 3 )
≈1.44
λ ρd ≈ 1
Model landform was hand
packed
Fig. 8.2 Landscape
simulator in which the runoff
simulation experiments were
conducted