

7.4 Results and Discussion
103
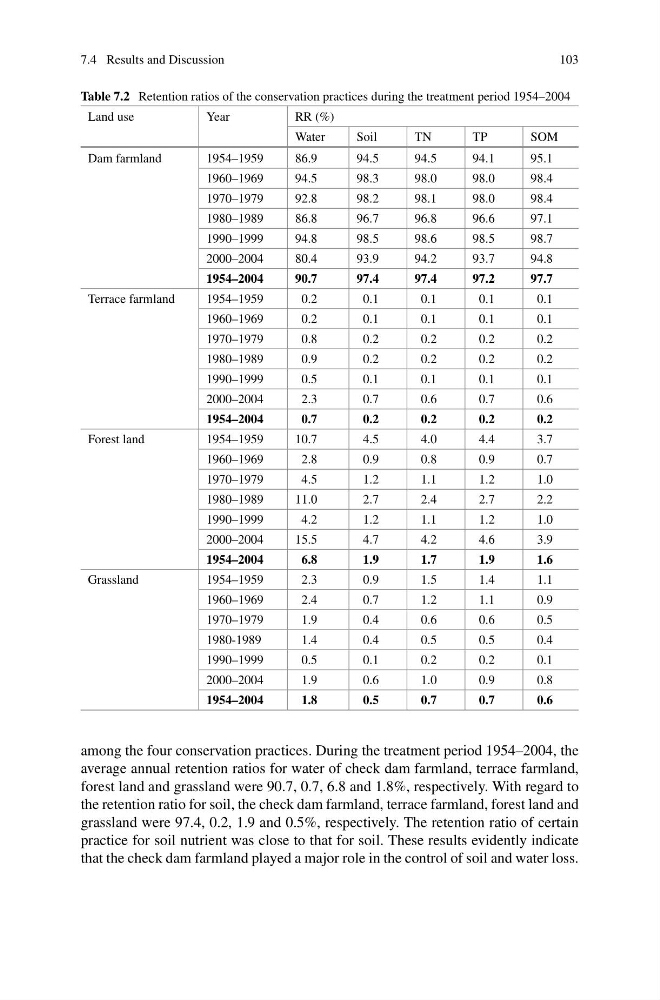
Table 7.2 Retention ratios of the conservation practices during the treatment period 1954–2004
Land use
Year
RR (%)
Water
Soil
TN
TP
SOM
Dam farmland
1954–1959
86.9
94.5
94.5
94.1
95.1
1960–1969
94.5
98.3
98.0
98.0
98.4
1970–1979
92.8
98.2
98.1
98.0
98.4
1980–1989
86.8
96.7
96.8
96.6
97.1
1990–1999
94.8
98.5
98.6
98.5
98.7
2000–2004
80.4
93.9
94.2
93.7
94.8
1954–2004
90.7
97.4
97.4
97.2
97.7
Terrace farmland
1954–1959
0.2
0.1
0.1
0.1
0.1
1960–1969
0.2
0.1
0.1
0.1
0.1
1970–1979
0.8
0.2
0.2
0.2
0.2
1980–1989
0.9
0.2
0.2
0.2
0.2
1990–1999
0.5
0.1
0.1
0.1
0.1
2000–2004
2.3
0.7
0.6
0.7
0.6
1954–2004
0.7
0.2
0.2
0.2
0.2
Forest land
1954–1959
10.7
4.5
4.0
4.4
3.7
1960–1969
2.8
0.9
0.8
0.9
0.7
1970–1979
4.5
1.2
1.1
1.2
1.0
1980–1989
11.0
2.7
2.4
2.7
2.2
1990–1999
4.2
1.2
1.1
1.2
1.0
2000–2004
15.5
4.7
4.2
4.6
3.9
1954–2004
6.8
1.9
1.7
1.9
1.6
Grassland
1954–1959
2.3
0.9
1.5
1.4
1.1
1960–1969
2.4
0.7
1.2
1.1
0.9
1970–1979
1.9
0.4
0.6
0.6
0.5
1980-1989
1.4
0.4
0.5
0.5
0.4
1990–1999
0.5
0.1
0.2
0.2
0.1
2000–2004
1.9
0.6
1.0
0.9
0.8
1954–2004
1.8
0.5
0.7
0.7
0.6
among the four conservation practices. During the treatment period 1954–2004, the
average annual retention ratios for water of check dam farmland, terrace farmland,
forest land and grassland were 90.7, 0.7, 6.8 and 1.8%, respectively. With regard to
the retention ratio for soil, the check dam farmland, terrace farmland, forest land and
grassland were 97.4, 0.2, 1.9 and 0.5%, respectively. The retention ratio of certain
practice for soil nutrient was close to that for soil. These results evidently indicate
that the check dam farmland played a major role in the control of soil and water loss.
103
Table 7.2 Retention ratios of the conservation practices during the treatment period 1954–2004
Land use
Year
RR (%)
Water
Soil
TN
TP
SOM
Dam farmland
1954–1959
86.9
94.5
94.5
94.1
95.1
1960–1969
94.5
98.3
98.0
98.0
98.4
1970–1979
92.8
98.2
98.1
98.0
98.4
1980–1989
86.8
96.7
96.8
96.6
97.1
1990–1999
94.8
98.5
98.6
98.5
98.7
2000–2004
80.4
93.9
94.2
93.7
94.8
1954–2004
90.7
97.4
97.4
97.2
97.7
Terrace farmland
1954–1959
0.2
0.1
0.1
0.1
0.1
1960–1969
0.2
0.1
0.1
0.1
0.1
1970–1979
0.8
0.2
0.2
0.2
0.2
1980–1989
0.9
0.2
0.2
0.2
0.2
1990–1999
0.5
0.1
0.1
0.1
0.1
2000–2004
2.3
0.7
0.6
0.7
0.6
1954–2004
0.7
0.2
0.2
0.2
0.2
Forest land
1954–1959
10.7
4.5
4.0
4.4
3.7
1960–1969
2.8
0.9
0.8
0.9
0.7
1970–1979
4.5
1.2
1.1
1.2
1.0
1980–1989
11.0
2.7
2.4
2.7
2.2
1990–1999
4.2
1.2
1.1
1.2
1.0
2000–2004
15.5
4.7
4.2
4.6
3.9
1954–2004
6.8
1.9
1.7
1.9
1.6
Grassland
1954–1959
2.3
0.9
1.5
1.4
1.1
1960–1969
2.4
0.7
1.2
1.1
0.9
1970–1979
1.9
0.4
0.6
0.6
0.5
1980-1989
1.4
0.4
0.5
0.5
0.4
1990–1999
0.5
0.1
0.2
0.2
0.1
2000–2004
1.9
0.6
1.0
0.9
0.8
1954–2004
1.8
0.5
0.7
0.7
0.6
among the four conservation practices. During the treatment period 1954–2004, the
average annual retention ratios for water of check dam farmland, terrace farmland,
forest land and grassland were 90.7, 0.7, 6.8 and 1.8%, respectively. With regard to
the retention ratio for soil, the check dam farmland, terrace farmland, forest land and
grassland were 97.4, 0.2, 1.9 and 0.5%, respectively. The retention ratio of certain
practice for soil nutrient was close to that for soil. These results evidently indicate
that the check dam farmland played a major role in the control of soil and water loss.