

7.3 Methods and Materials
101
the Nanxiaohegou Catchment, is so small as to be neglected. As a consequence, the
runoff together with the soil nutrients retained by the conservation practice during
the flood period is locally absorbed. Thus the amount of nutrient in the soil retained
on the dry conservation practice land after an event of representative rainfall is close
to that retained during the rainfall. For the Nanxiaohegou Catchment, almost all
transported soil has been retained by the following four practices: the dam farmland,
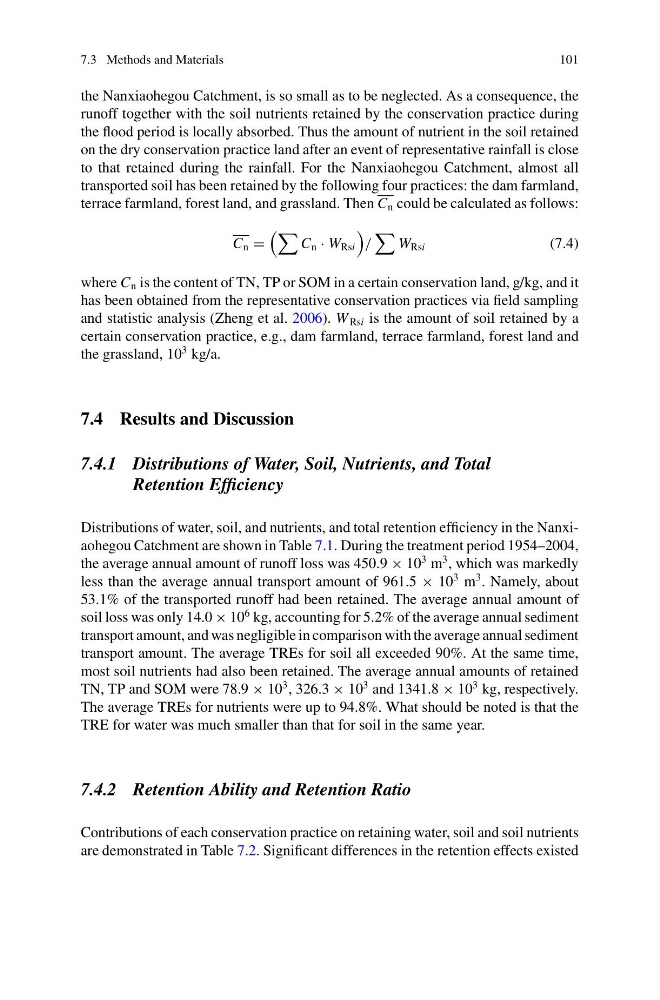
terrace farmland, forest land, and grassland. Then C n could be calculated as follows:
C n =
C n · W Rsi
/
W Rsi
(7.4)
where C n is the content of TN, TP or SOM in a certain conservation land, g/kg, and it
has been obtained from the representative conservation practices via field sampling
and statistic analysis (Zheng et al. 2006). W Rsi is the amount of soil retained by a
certain conservation practice, e.g., dam farmland, terrace farmland, forest land and
the grassland, 10
3 kg/a.
7.4 Results and Discussion
7.4.1 Distributions of Water, Soil, Nutrients, and Total
Retention Efficiency
Distributions of water, soil, and nutrients, and total retention efficiency in the Nanxiaohegou Catchment are shown in Table 7.1. During the treatment period 1954–2004,
the average annual amount of runoff loss was 450.9 × 10
3 m
3 , which was markedly
less than the average annual transport amount of 961.5 × 10
3 m
3 . Namely, about
53.1% of the transported runoff had been retained. The average annual amount of
soil loss was only 14.0 × 10
6 kg, accounting for 5.2% of the average annual sediment
transport amount, and was negligible in comparison with the average annual sediment
transport amount. The average TREs for soil all exceeded 90%. At the same time,
most soil nutrients had also been retained. The average annual amounts of retained
TN, TP and SOM were 78.9 × 10
3 , 326.3 × 10
3 and 1341.8 × 10
3 kg, respectively.
The average TREs for nutrients were up to 94.8%. What should be noted is that the
TRE for water was much smaller than that for soil in the same year.
7.4.2 Retention Ability and Retention Ratio
Contributions of each conservation practice on retaining water, soil and soil nutrients
are demonstrated in Table 7.2. Significant differences in the retention effects existed
101
the Nanxiaohegou Catchment, is so small as to be neglected. As a consequence, the
runoff together with the soil nutrients retained by the conservation practice during
the flood period is locally absorbed. Thus the amount of nutrient in the soil retained
on the dry conservation practice land after an event of representative rainfall is close
to that retained during the rainfall. For the Nanxiaohegou Catchment, almost all
transported soil has been retained by the following four practices: the dam farmland,
terrace farmland, forest land, and grassland. Then C n could be calculated as follows:
C n =
C n · W Rsi
/
W Rsi
(7.4)
where C n is the content of TN, TP or SOM in a certain conservation land, g/kg, and it
has been obtained from the representative conservation practices via field sampling
and statistic analysis (Zheng et al. 2006). W Rsi is the amount of soil retained by a
certain conservation practice, e.g., dam farmland, terrace farmland, forest land and
the grassland, 10
3 kg/a.
7.4 Results and Discussion
7.4.1 Distributions of Water, Soil, Nutrients, and Total
Retention Efficiency
Distributions of water, soil, and nutrients, and total retention efficiency in the Nanxiaohegou Catchment are shown in Table 7.1. During the treatment period 1954–2004,
the average annual amount of runoff loss was 450.9 × 10
3 m
3 , which was markedly
less than the average annual transport amount of 961.5 × 10
3 m
3 . Namely, about
53.1% of the transported runoff had been retained. The average annual amount of
soil loss was only 14.0 × 10
6 kg, accounting for 5.2% of the average annual sediment
transport amount, and was negligible in comparison with the average annual sediment
transport amount. The average TREs for soil all exceeded 90%. At the same time,
most soil nutrients had also been retained. The average annual amounts of retained
TN, TP and SOM were 78.9 × 10
3 , 326.3 × 10
3 and 1341.8 × 10
3 kg, respectively.
The average TREs for nutrients were up to 94.8%. What should be noted is that the
TRE for water was much smaller than that for soil in the same year.
7.4.2 Retention Ability and Retention Ratio
Contributions of each conservation practice on retaining water, soil and soil nutrients
are demonstrated in Table 7.2. Significant differences in the retention effects existed