

182
length of transect varied from 20 to 250 m depending upon the horizontal extent of
beds to the shore. Each transect was divided into three zones, namely, low tide (LT),
mid-tide (MT) and high tide (HT). Sampling interval varied at different stations
from 5 to 50 m, depending upon the transect length. At each station, two to three
perpendicular transects were laid down, depending upon the extent of beds parallel
to the shore. The biomass was estimated by removing all the plants along with roots,
rhizomes and shoots from five quadrants (each of 1 m
2
size), from each tidal zone.
Plant material was thoroughly washed in the ambient water immediately after
collections, as well as with tap water, to remove adhering debris and sediments. The
various vegetative parts (above and below ground) were separated and sun dried and
weighed and the results were expressed as gm m
−2
on an average basis for different
tidal zones.
In this salt marsh grass species, we observed more BGB (~65%) compared to
AGB (~35%). Also we observed significant spatial variation in the AGB and BGB
of the species. The AGB of the species was more in the Hooghly estuarine region
(186.88 gm m
−2
to 262.82 gm m
−2
) compared to those sampled from the intertidal
mudflats of the Mandovi estuary (98.66 gm m
−2
to 173.66 gm m
−2
) (Fig. 6.25). The
BGB ranges from 238.61 gm m
−2
to 293.12 gm m
−2
in the Hooghly estuarine stretch
and in the Mandovi estuary the BGB ranges from 116.52 gm m
−2
to 273.67 gm m
−2
(Fig. 6.26). Interestingly it has been observed that the mean annual rate of sediment
accretion (in mm yr
−1
) in the Porteresia bed was 9.85 and 4.60 in the Hooghly and
Mandovi estuarine stretch respectively.
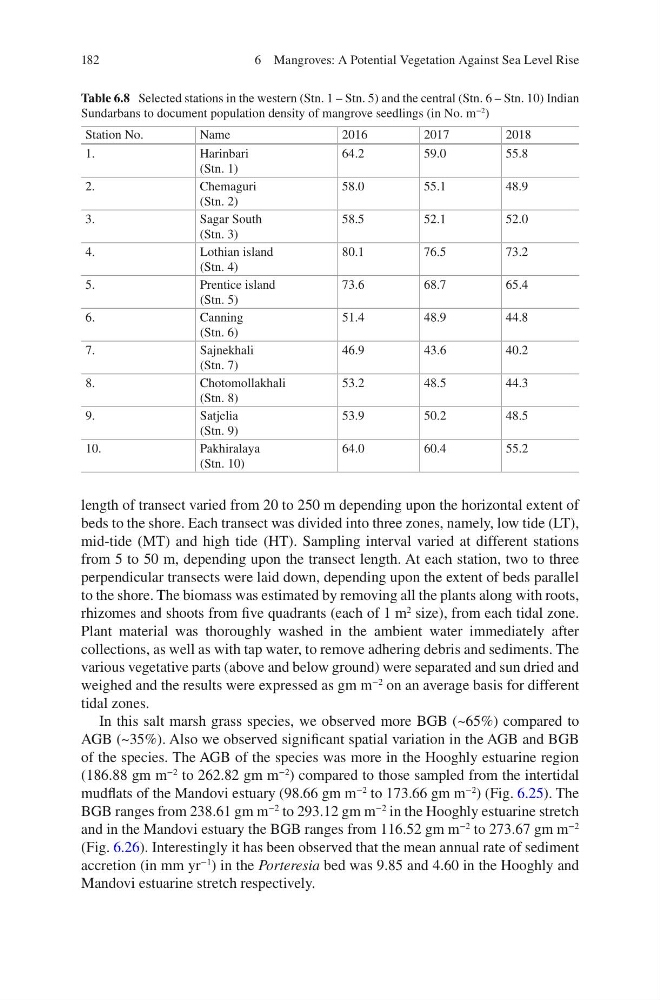
Table 6.8 Selected stations in the western (Stn. 1 – Stn. 5) and the central (Stn. 6 – Stn. 10) Indian
Sundarbans to document population density of mangrove seedlings (in No. m
−2
)
Station No.
Name
2016
2017
2018
1.
Harinbari
(Stn. 1)
64.2
59.0
55.8
2.
Chemaguri
(Stn. 2)
58.0
55.1
48.9
3.
Sagar South
(Stn. 3)
58.5
52.1
52.0
4.
Lothian island
(Stn. 4)
80.1
76.5
73.2
5.
Prentice island
(Stn. 5)
73.6
68.7
65.4
6.
Canning
(Stn. 6)
51.4
48.9
44.8
7.
Sajnekhali
(Stn. 7)
46.9
43.6
40.2
8.
Chotomollakhali
(Stn. 8)
53.2
48.5
44.3
9.
Satjelia
(Stn. 9)
53.9
50.2
48.5
10.
Pakhiralaya
(Stn. 10)
64.0
60.4
55.2
6 Mangroves: A Potential Vegetation Against Sea Level Rise
length of transect varied from 20 to 250 m depending upon the horizontal extent of
beds to the shore. Each transect was divided into three zones, namely, low tide (LT),
mid-tide (MT) and high tide (HT). Sampling interval varied at different stations
from 5 to 50 m, depending upon the transect length. At each station, two to three
perpendicular transects were laid down, depending upon the extent of beds parallel
to the shore. The biomass was estimated by removing all the plants along with roots,
rhizomes and shoots from five quadrants (each of 1 m
2
size), from each tidal zone.
Plant material was thoroughly washed in the ambient water immediately after
collections, as well as with tap water, to remove adhering debris and sediments. The
various vegetative parts (above and below ground) were separated and sun dried and
weighed and the results were expressed as gm m
−2
on an average basis for different
tidal zones.
In this salt marsh grass species, we observed more BGB (~65%) compared to
AGB (~35%). Also we observed significant spatial variation in the AGB and BGB
of the species. The AGB of the species was more in the Hooghly estuarine region
(186.88 gm m
−2
to 262.82 gm m
−2
) compared to those sampled from the intertidal
mudflats of the Mandovi estuary (98.66 gm m
−2
to 173.66 gm m
−2
) (Fig. 6.25). The
BGB ranges from 238.61 gm m
−2
to 293.12 gm m
−2
in the Hooghly estuarine stretch
and in the Mandovi estuary the BGB ranges from 116.52 gm m
−2
to 273.67 gm m
−2
(Fig. 6.26). Interestingly it has been observed that the mean annual rate of sediment
accretion (in mm yr
−1
) in the Porteresia bed was 9.85 and 4.60 in the Hooghly and
Mandovi estuarine stretch respectively.
Table 6.8 Selected stations in the western (Stn. 1 – Stn. 5) and the central (Stn. 6 – Stn. 10) Indian
Sundarbans to document population density of mangrove seedlings (in No. m
−2
)
Station No.
Name
2016
2017
2018
1.
Harinbari
(Stn. 1)
64.2
59.0
55.8
2.
Chemaguri
(Stn. 2)
58.0
55.1
48.9
3.
Sagar South
(Stn. 3)
58.5
52.1
52.0
4.
Lothian island
(Stn. 4)
80.1
76.5
73.2
5.
Prentice island
(Stn. 5)
73.6
68.7
65.4
6.
Canning
(Stn. 6)
51.4
48.9
44.8
7.
Sajnekhali
(Stn. 7)
46.9
43.6
40.2
8.
Chotomollakhali
(Stn. 8)
53.2
48.5
44.3
9.
Satjelia
(Stn. 9)
53.9
50.2
48.5
10.
Pakhiralaya
(Stn. 10)
64.0
60.4
55.2
6 Mangroves: A Potential Vegetation Against Sea Level Rise