

158
The three primary contributing factors to sea level rise often cited are: (1) ocean
thermal expansion (2) glacial melt from Greenland and Antarctica (plus a smaller
contribution from other ice sheets) and (3) the change in terrestrial storage. Until
recently, ocean thermal expansion was expected to be the dominating factor behind
the rise in sea level. However, new data sets on rates of deglaciation in Greenland
and Antarctica suggest significant contribution of glacial melt, especially due to the
uncertainty surrounding the dynamics of outlet glaciers (Hansen et al. 2005; Hanna
et al. 2005; Howat et al. 2007; Krabill et al. 2004; Meier et al. 2007; Rignot and
Kanagaratnam 2006; Stroeve et al. 2007; Velicogna and Wahr 2006). Although there
is continued evidence of ice sheet growth in the Eastern regions of Antarctica (Davis
et al. 2005), when coupled with the measured losses in the West, and including
Greenland, the evidence appears to point in the direction of increased sea level rise.
The implications of these findings for sea level rise could be dramatic. The Greenland
and Antarctic ice sheets contain enough water to raise the sea level by almost 70 m
(Hansen et al. 2005), so even small changes in the their volume would have a significant effect.
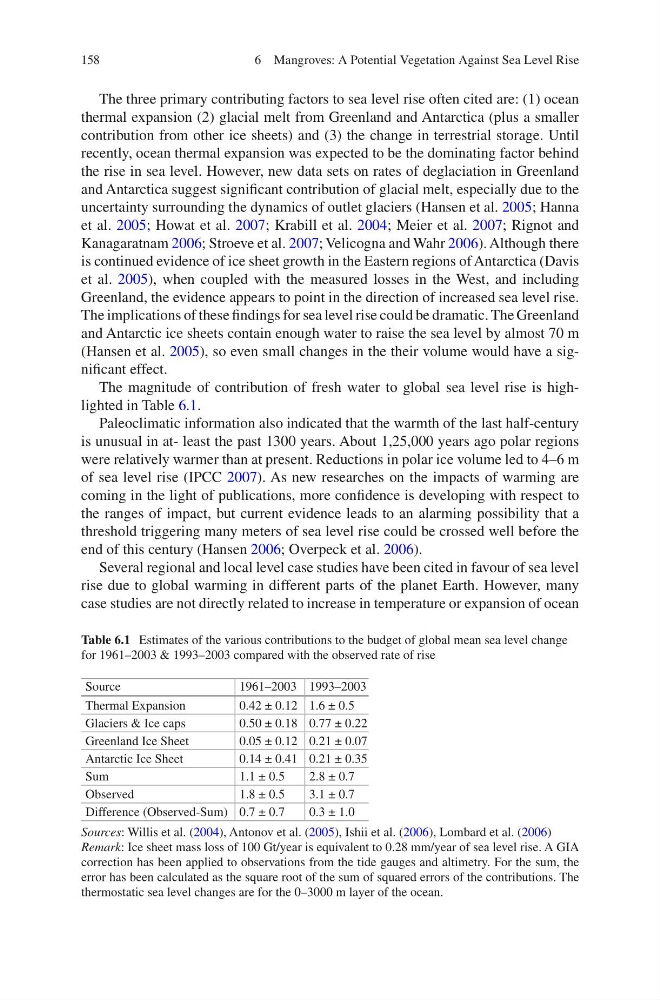
The magnitude of contribution of fresh water to global sea level rise is highlighted in Table 6.1.
Paleoclimatic information also indicated that the warmth of the last half-century
is unusual in at- least the past 1300 years. About 1,25,000 years ago polar regions
were relatively warmer than at present. Reductions in polar ice volume led to 4–6 m
of sea level rise (IPCC 2007). As new researches on the impacts of warming are
coming in the light of publications, more confidence is developing with respect to
the ranges of impact, but current evidence leads to an alarming possibility that a
threshold triggering many meters of sea level rise could be crossed well before the
end of this century (Hansen 2006; Overpeck et al. 2006).
Several regional and local level case studies have been cited in favour of sea level
rise due to global warming in different parts of the planet Earth. However, many
case studies are not directly related to increase in temperature or expansion of ocean
Source
1961–2003 1993–2003
Thermal Expansion
0.42 ± 0.12 1.6 ± 0.5
Glaciers & Ice caps
0.50 ± 0.18 0.77 ± 0.22
Greenland Ice Sheet
0.05 ± 0.12 0.21 ± 0.07
Antarctic Ice Sheet
0.14 ± 0.41 0.21 ± 0.35
Sum
1.1 ± 0.5
2.8 ± 0.7
Observed
1.8 ± 0.5
3.1 ± 0.7
Difference (Observed-Sum) 0.7 ± 0.7
0.3 ± 1.0
Sources: Willis et al. (2004), Antonov et al. (2005), Ishii et al. (2006), Lombard et al. (2006)
Remark: Ice sheet mass loss of 100 Gt/year is equivalent to 0.28 mm/year of sea level rise. A GIA
correction has been applied to observations from the tide gauges and altimetry. For the sum, the
error has been calculated as the square root of the sum of squared errors of the contributions. The
thermostatic sea level changes are for the 0–3000 m layer of the ocean.
Table 6.1 Estimates of the various contributions to the budget of global mean sea level change
for 1961–2003 & 1993–2003 compared with the observed rate of rise
6 Mangroves: A Potential Vegetation Against Sea Level Rise
The three primary contributing factors to sea level rise often cited are: (1) ocean
thermal expansion (2) glacial melt from Greenland and Antarctica (plus a smaller
contribution from other ice sheets) and (3) the change in terrestrial storage. Until
recently, ocean thermal expansion was expected to be the dominating factor behind
the rise in sea level. However, new data sets on rates of deglaciation in Greenland
and Antarctica suggest significant contribution of glacial melt, especially due to the
uncertainty surrounding the dynamics of outlet glaciers (Hansen et al. 2005; Hanna
et al. 2005; Howat et al. 2007; Krabill et al. 2004; Meier et al. 2007; Rignot and
Kanagaratnam 2006; Stroeve et al. 2007; Velicogna and Wahr 2006). Although there
is continued evidence of ice sheet growth in the Eastern regions of Antarctica (Davis
et al. 2005), when coupled with the measured losses in the West, and including
Greenland, the evidence appears to point in the direction of increased sea level rise.
The implications of these findings for sea level rise could be dramatic. The Greenland
and Antarctic ice sheets contain enough water to raise the sea level by almost 70 m
(Hansen et al. 2005), so even small changes in the their volume would have a significant effect.
The magnitude of contribution of fresh water to global sea level rise is highlighted in Table 6.1.
Paleoclimatic information also indicated that the warmth of the last half-century
is unusual in at- least the past 1300 years. About 1,25,000 years ago polar regions
were relatively warmer than at present. Reductions in polar ice volume led to 4–6 m
of sea level rise (IPCC 2007). As new researches on the impacts of warming are
coming in the light of publications, more confidence is developing with respect to
the ranges of impact, but current evidence leads to an alarming possibility that a
threshold triggering many meters of sea level rise could be crossed well before the
end of this century (Hansen 2006; Overpeck et al. 2006).
Several regional and local level case studies have been cited in favour of sea level
rise due to global warming in different parts of the planet Earth. However, many
case studies are not directly related to increase in temperature or expansion of ocean
Source
1961–2003 1993–2003
Thermal Expansion
0.42 ± 0.12 1.6 ± 0.5
Glaciers & Ice caps
0.50 ± 0.18 0.77 ± 0.22
Greenland Ice Sheet
0.05 ± 0.12 0.21 ± 0.07
Antarctic Ice Sheet
0.14 ± 0.41 0.21 ± 0.35
Sum
1.1 ± 0.5
2.8 ± 0.7
Observed
1.8 ± 0.5
3.1 ± 0.7
Difference (Observed-Sum) 0.7 ± 0.7
0.3 ± 1.0
Sources: Willis et al. (2004), Antonov et al. (2005), Ishii et al. (2006), Lombard et al. (2006)
Remark: Ice sheet mass loss of 100 Gt/year is equivalent to 0.28 mm/year of sea level rise. A GIA
correction has been applied to observations from the tide gauges and altimetry. For the sum, the
error has been calculated as the square root of the sum of squared errors of the contributions. The
thermostatic sea level changes are for the 0–3000 m layer of the ocean.
Table 6.1 Estimates of the various contributions to the budget of global mean sea level change
for 1961–2003 & 1993–2003 compared with the observed rate of rise
6 Mangroves: A Potential Vegetation Against Sea Level Rise