

99
At Diamond Harbour, dissolved silicate concentration ranged from 101.83 ppm
(during premonsoon in 1984) to 242.78 ppm (during premonsoon in 2009)
(Fig. 4.17). At Namkhana, it ranged from 44.68 ppm (during premonsoon in 1984)
to 211.49 ppm (during premonsoon in 2009) (Fig. 4.18). In case of Ajmalmari, the
silicate ranged from 31.43 ppm (during premonsoon in 1984) to 111.99 ppm (during
premonsoon in 2009) (Fig. 4.19).
In both Diamond Harbour and Namkhana of the Hooghly estuarine system, silicate has increased 64.57 μg at l
−1
/decade and 54.56 μg at l
−1
/decade respectively.
The rate of increase is 31.18 μg at l
−1
/decade in Ajmalmari, which is relatively low
compared to stations selected in the Hooghly estuary.
It is interesting to note from all these figures that there is a sudden hike of nitrate,
phosphate and silicate during premonsoon 2009, which is attributed to massive erosion of the embankment during 23rd to 25th May, 2009, caused by the super cyclone
Aila. This super cyclone passed across the lower Gangetic delta region with a speed
of ~120 km/hr during this period of time. Mangrove nutrients are also regulated by
tidal phase and salinity. Dissolved Organic Nitrogen (DON) exhibit an inverse relationship with salinity (Nixon et al. 1984; Wong 1984). During a tidal cycle highest
concentration occurs at high tide and decreases during ebb tide (Guerrero et al.
1988; Ovalle et al. 1990).
The main sources of nutrient input in mangrove dominated Indian Sundarbans
are run-off from the adjacent landmasses (Mitra 2013), erosion and leaching (Mitra
et al. 2009), sewage from cities and industrial wastewater (Mitra and Choudhury
1993; Mitra 1998; Bhattacharyya et al. 2013), untreated sewage disposal from
shrimp farms and tourism units (Mitra 2013; Zaman and Mitra 2014; Mitra and
Zaman 2015). Atmospheric deposition of nitrogen (from combustion gases) can
also be important for Hooghly estuarine system and its surrounding area as multifarious industries are concentrated in this estuarine region (Annexure A).
Most of the phosphorus pollution in the present study area comes from the
households and industries including phosphorus-based detergents which are widely
used in thickly populated cities of Kolkata, Howrah and Haldia industrial complex
adjacent to the Hooghly estuary.
Silicate being an important ingredient of bed material and soil substratum, originate due to erosion, churning action of the water that amplifies during tropical
cyclone, which is common in the present geographical locale.
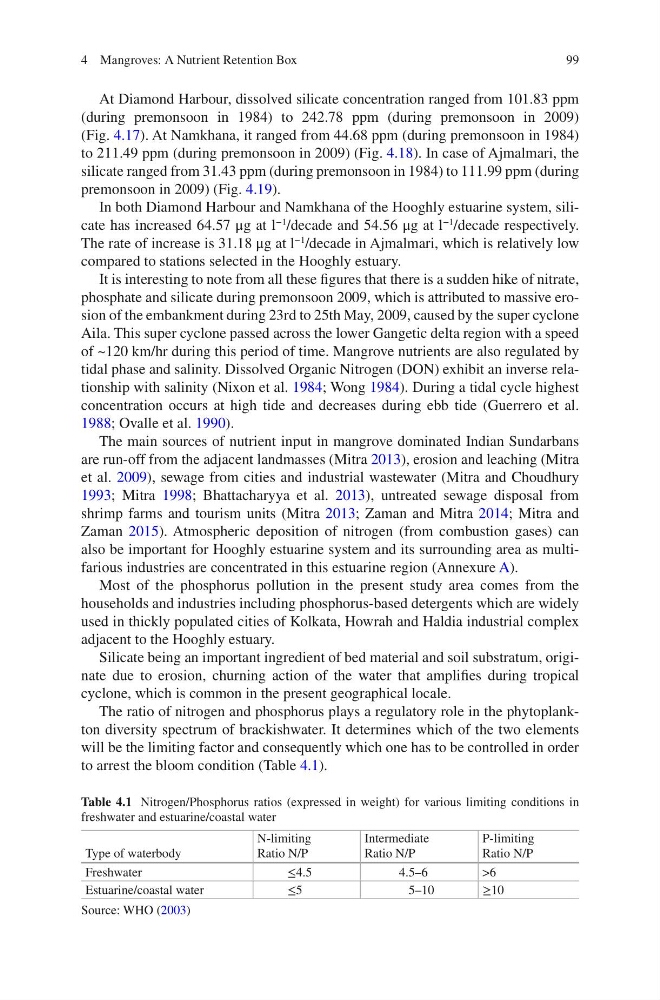
The ratio of nitrogen and phosphorus plays a regulatory role in the phytoplankton diversity spectrum of brackishwater. It determines which of the two elements
will be the limiting factor and consequently which one has to be controlled in order
to arrest the bloom condition (Table 4.1).
Table 4.1 Nitrogen/Phosphorus ratios (expressed in weight) for various limiting conditions in
freshwater and estuarine/coastal water
Type of waterbody
N-limiting
Ratio N/P
Intermediate
Ratio N/P
P-limiting
Ratio N/P
Freshwater
≤4.5
4.5–6
>6
Estuarine/coastal water
≤5
5–10
≥10
Source: WHO (2003)
4 Mangroves: A Nutrient Retention Box
At Diamond Harbour, dissolved silicate concentration ranged from 101.83 ppm
(during premonsoon in 1984) to 242.78 ppm (during premonsoon in 2009)
(Fig. 4.17). At Namkhana, it ranged from 44.68 ppm (during premonsoon in 1984)
to 211.49 ppm (during premonsoon in 2009) (Fig. 4.18). In case of Ajmalmari, the
silicate ranged from 31.43 ppm (during premonsoon in 1984) to 111.99 ppm (during
premonsoon in 2009) (Fig. 4.19).
In both Diamond Harbour and Namkhana of the Hooghly estuarine system, silicate has increased 64.57 μg at l
−1
/decade and 54.56 μg at l
−1
/decade respectively.
The rate of increase is 31.18 μg at l
−1
/decade in Ajmalmari, which is relatively low
compared to stations selected in the Hooghly estuary.
It is interesting to note from all these figures that there is a sudden hike of nitrate,
phosphate and silicate during premonsoon 2009, which is attributed to massive erosion of the embankment during 23rd to 25th May, 2009, caused by the super cyclone
Aila. This super cyclone passed across the lower Gangetic delta region with a speed
of ~120 km/hr during this period of time. Mangrove nutrients are also regulated by
tidal phase and salinity. Dissolved Organic Nitrogen (DON) exhibit an inverse relationship with salinity (Nixon et al. 1984; Wong 1984). During a tidal cycle highest
concentration occurs at high tide and decreases during ebb tide (Guerrero et al.
1988; Ovalle et al. 1990).
The main sources of nutrient input in mangrove dominated Indian Sundarbans
are run-off from the adjacent landmasses (Mitra 2013), erosion and leaching (Mitra
et al. 2009), sewage from cities and industrial wastewater (Mitra and Choudhury
1993; Mitra 1998; Bhattacharyya et al. 2013), untreated sewage disposal from
shrimp farms and tourism units (Mitra 2013; Zaman and Mitra 2014; Mitra and
Zaman 2015). Atmospheric deposition of nitrogen (from combustion gases) can
also be important for Hooghly estuarine system and its surrounding area as multifarious industries are concentrated in this estuarine region (Annexure A).
Most of the phosphorus pollution in the present study area comes from the
households and industries including phosphorus-based detergents which are widely
used in thickly populated cities of Kolkata, Howrah and Haldia industrial complex
adjacent to the Hooghly estuary.
Silicate being an important ingredient of bed material and soil substratum, originate due to erosion, churning action of the water that amplifies during tropical
cyclone, which is common in the present geographical locale.
The ratio of nitrogen and phosphorus plays a regulatory role in the phytoplankton diversity spectrum of brackishwater. It determines which of the two elements
will be the limiting factor and consequently which one has to be controlled in order
to arrest the bloom condition (Table 4.1).
Table 4.1 Nitrogen/Phosphorus ratios (expressed in weight) for various limiting conditions in
freshwater and estuarine/coastal water
Type of waterbody
N-limiting
Ratio N/P
Intermediate
Ratio N/P
P-limiting
Ratio N/P
Freshwater
≤4.5
4.5–6
>6
Estuarine/coastal water
≤5
5–10
≥10
Source: WHO (2003)
4 Mangroves: A Nutrient Retention Box