

4.3 Carbon Black Dispersion as Revealed by 3D-TEM
73
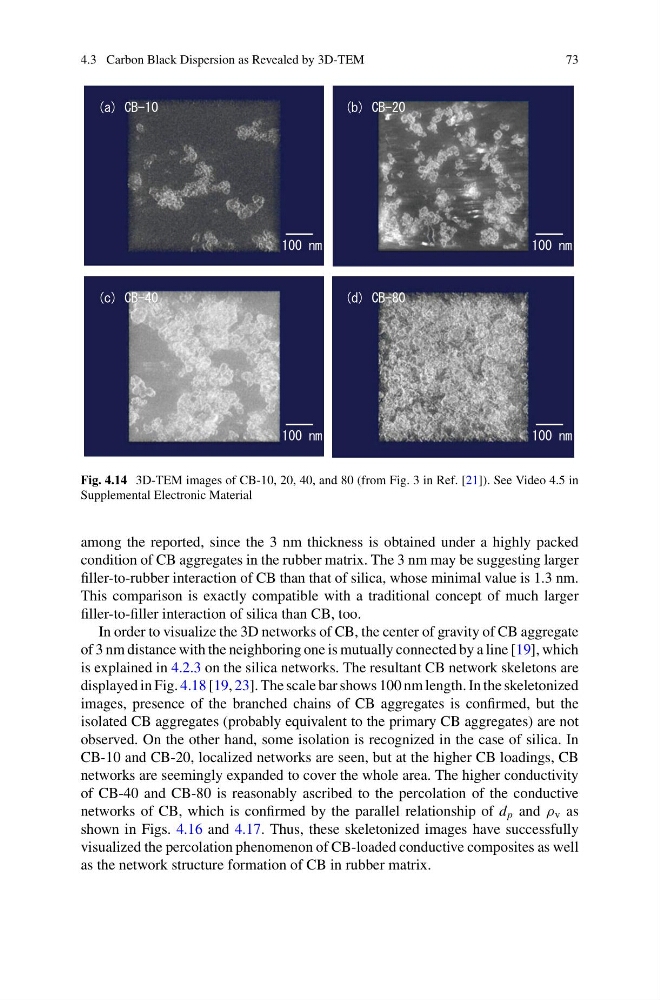
Fig. 4.14 3D-TEM images of CB-10, 20, 40, and 80 (from Fig. 3 in Ref. [21]). See Video 4.5 in
Supplemental Electronic Material
among the reported, since the 3 nm thickness is obtained under a highly packed
condition of CB aggregates in the rubber matrix. The 3 nm may be suggesting larger
filler-to-rubber interaction of CB than that of silica, whose minimal value is 1.3 nm.
This comparison is exactly compatible with a traditional concept of much larger
filler-to-filler interaction of silica than CB, too.
In order to visualize the 3D networks of CB, the center of gravity of CB aggregate
of 3 nm distance with the neighboring one is mutually connected by a line [19], which
is explained in 4.2.3 on the silica networks. The resultant CB network skeletons are
displayed in Fig. 4.18 [19, 23]. The scale bar shows 100 nm length. In the skeletonized
images, presence of the branched chains of CB aggregates is confirmed, but the
isolated CB aggregates (probably equivalent to the primary CB aggregates) are not
observed. On the other hand, some isolation is recognized in the case of silica. In
CB-10 and CB-20, localized networks are seen, but at the higher CB loadings, CB
networks are seemingly expanded to cover the whole area. The higher conductivity
of CB-40 and CB-80 is reasonably ascribed to the percolation of the conductive
networks of CB, which is confirmed by the parallel relationship of d p and ρ v as
shown in Figs. 4.16 and 4.17. Thus, these skeletonized images have successfully
visualized the percolation phenomenon of CB-loaded conductive composites as well
as the network structure formation of CB in rubber matrix.
73
Fig. 4.14 3D-TEM images of CB-10, 20, 40, and 80 (from Fig. 3 in Ref. [21]). See Video 4.5 in
Supplemental Electronic Material
among the reported, since the 3 nm thickness is obtained under a highly packed
condition of CB aggregates in the rubber matrix. The 3 nm may be suggesting larger
filler-to-rubber interaction of CB than that of silica, whose minimal value is 1.3 nm.
This comparison is exactly compatible with a traditional concept of much larger
filler-to-filler interaction of silica than CB, too.
In order to visualize the 3D networks of CB, the center of gravity of CB aggregate
of 3 nm distance with the neighboring one is mutually connected by a line [19], which
is explained in 4.2.3 on the silica networks. The resultant CB network skeletons are
displayed in Fig. 4.18 [19, 23]. The scale bar shows 100 nm length. In the skeletonized
images, presence of the branched chains of CB aggregates is confirmed, but the
isolated CB aggregates (probably equivalent to the primary CB aggregates) are not
observed. On the other hand, some isolation is recognized in the case of silica. In
CB-10 and CB-20, localized networks are seen, but at the higher CB loadings, CB
networks are seemingly expanded to cover the whole area. The higher conductivity
of CB-40 and CB-80 is reasonably ascribed to the percolation of the conductive
networks of CB, which is confirmed by the parallel relationship of d p and ρ v as
shown in Figs. 4.16 and 4.17. Thus, these skeletonized images have successfully
visualized the percolation phenomenon of CB-loaded conductive composites as well
as the network structure formation of CB in rubber matrix.