

1 3
Topics in Current Chemistry (2019) 377:24
[29]. Finally, XPS can render information about the oxidation state of the cations
and anions of the material [30, 31].
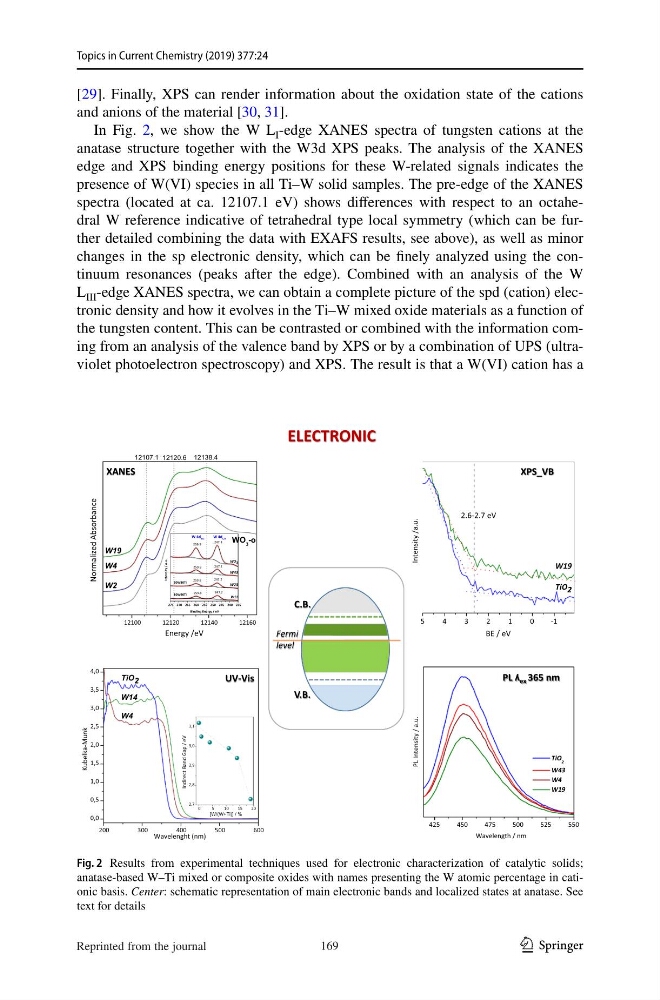
In Fig. 2, we show the W L I -edge XANES spectra of tungsten cations at the
anatase structure together with the W3d XPS peaks. The analysis of the XANES
edge and XPS binding energy positions for these W-related signals indicates the
presence of W(VI) species in all Ti–W solid samples. The pre-edge of the XANES
spectra (located at ca. 12107.1 eV) shows differences with respect to an octahedral W reference indicative of tetrahedral type local symmetry (which can be further detailed combining the data with EXAFS results, see above), as well as minor
changes in the sp electronic density, which can be finely analyzed using the continuum resonances (peaks after the edge). Combined with an analysis of the W
L III -edge XANES spectra, we can obtain a complete picture of the spd (cation) electronic density and how it evolves in the Ti–W mixed oxide materials as a function of
the tungsten content. This can be contrasted or combined with the information coming from an analysis of the valence band by XPS or by a combination of UPS (ultraviolet photoelectron spectroscopy) and XPS. The result is that a W(VI) cation has a
ELECTRONIC
UV-Vis
XANES
PL ʎ ex 365 nm
200
3 00
400
5 00
600
0,0
0,5
1,0
1,5
2,0
2,5
3,0
3,5
4,0
Wavelenght (nm)
Kubelka-Munk
TiO 2
W4
W14
XPS_VB
V.B.
C.B.
Fermi
level
12100
12120
12140
12160
12138.4
12120.6
W2
W4
Normalized Absorbance
Energy /eV
W19
WO 3 -o
12107.1
0
5
10
15
20
2,7
2,8
2,9
3,0
3,1
[W/(W+Ti)] / %
V
e
/
p
a
G
d
n
a
B
t
c
e
r
i
d
n
I
5
4
3
2
1
0
-1
W19
Intensity /a.u.
BE / eV
2.6-2.7 eV
TiO 2
275 2 70 265 2 60 255 2 50 245 2 40 235
W11
W23
20W80Ti
10W90Ti
Intensity / a.u.
Binding Energy / eV
247.3
247.2
247.2
247.2
259.9
259.8
259.8
259.8
W 4d3/2
W 4d5/2
WO3
W43
425
4 50
475
5 00
525
5 50
PL Intensity / a.u.
Wavelength / nm
TiO 2
W43
W4
W19
Fig. 2 Results from experimental techniques used for electronic characterization of catalytic solids;
anatase-based W–Ti mixed or composite oxides with names presenting the W atomic percentage in cationic basis. Center: schematic representation of main electronic bands and localized states at anatase. See
text for details
169
Reprinted from the journal
Topics in Current Chemistry (2019) 377:24
[29]. Finally, XPS can render information about the oxidation state of the cations
and anions of the material [30, 31].
In Fig. 2, we show the W L I -edge XANES spectra of tungsten cations at the
anatase structure together with the W3d XPS peaks. The analysis of the XANES
edge and XPS binding energy positions for these W-related signals indicates the
presence of W(VI) species in all Ti–W solid samples. The pre-edge of the XANES
spectra (located at ca. 12107.1 eV) shows differences with respect to an octahedral W reference indicative of tetrahedral type local symmetry (which can be further detailed combining the data with EXAFS results, see above), as well as minor
changes in the sp electronic density, which can be finely analyzed using the continuum resonances (peaks after the edge). Combined with an analysis of the W
L III -edge XANES spectra, we can obtain a complete picture of the spd (cation) electronic density and how it evolves in the Ti–W mixed oxide materials as a function of
the tungsten content. This can be contrasted or combined with the information coming from an analysis of the valence band by XPS or by a combination of UPS (ultraviolet photoelectron spectroscopy) and XPS. The result is that a W(VI) cation has a
ELECTRONIC
UV-Vis
XANES
PL ʎ ex 365 nm
200
3 00
400
5 00
600
0,0
0,5
1,0
1,5
2,0
2,5
3,0
3,5
4,0
Wavelenght (nm)
Kubelka-Munk
TiO 2
W4
W14
XPS_VB
V.B.
C.B.
Fermi
level
12100
12120
12140
12160
12138.4
12120.6
W2
W4
Normalized Absorbance
Energy /eV
W19
WO 3 -o
12107.1
0
5
10
15
20
2,7
2,8
2,9
3,0
3,1
[W/(W+Ti)] / %
V
e
/
p
a
G
d
n
a
B
t
c
e
r
i
d
n
I
5
4
3
2
1
0
-1
W19
Intensity /a.u.
BE / eV
2.6-2.7 eV
TiO 2
275 2 70 265 2 60 255 2 50 245 2 40 235
W11
W23
20W80Ti
10W90Ti
Intensity / a.u.
Binding Energy / eV
247.3
247.2
247.2
247.2
259.9
259.8
259.8
259.8
W 4d3/2
W 4d5/2
WO3
W43
425
4 50
475
5 00
525
5 50
PL Intensity / a.u.
Wavelength / nm
TiO 2
W43
W4
W19
Fig. 2 Results from experimental techniques used for electronic characterization of catalytic solids;
anatase-based W–Ti mixed or composite oxides with names presenting the W atomic percentage in cationic basis. Center: schematic representation of main electronic bands and localized states at anatase. See
text for details
169
Reprinted from the journal