

Topics in Current Chemistry (2019) 377:11
1 3
Our studies on several Pt–Ir–SnO 2 catalysts indicated that Ir could split the
C–C bond in ethanol [31]. While it was difficult to obtain the internal structure of
the nanoparticles with Ir and Pt due to the close proximity of their L 3 edges, the
XANES spectra can be used to reveal the mole ratio of the two metals. In our study
of the catalyst with Pt:Ir:Sn = 1:1:1 atomic ratio, we found that the edge step (Δμ 0 ,
cf. Fig. 2) of Ir L 3 and Pt L 3 are approximately equal (both ca. 0.5). Because their
absorption intensities are close, the Pt/Ir ratio is approximately 1, which is consistent with the nominal value [111].
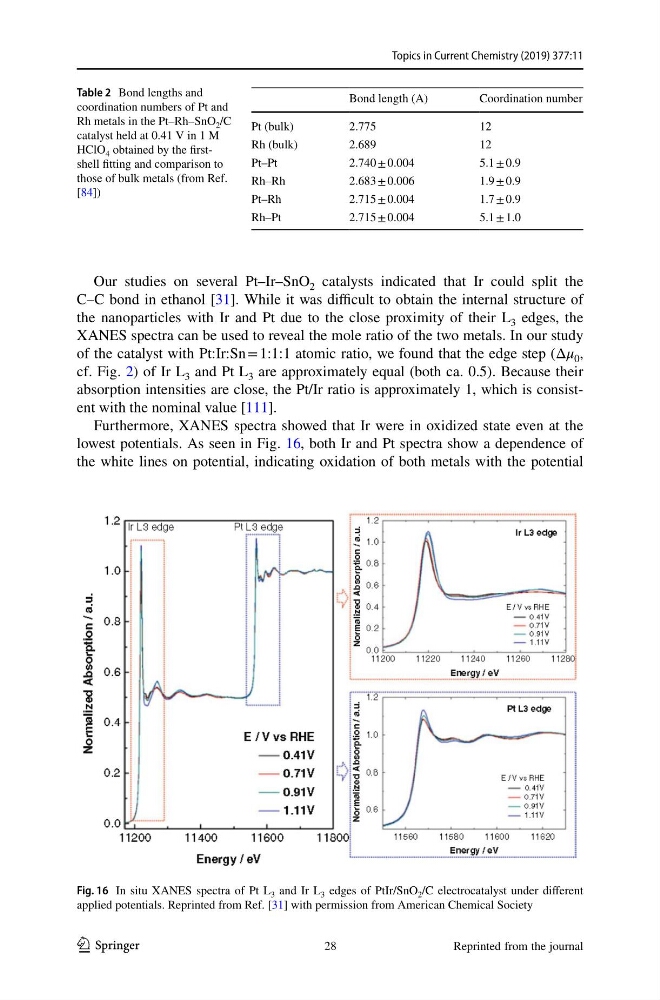
Furthermore, XANES spectra showed that Ir were in oxidized state even at the
lowest potentials. As seen in Fig. 16, both Ir and Pt spectra show a dependence of
the white lines on potential, indicating oxidation of both metals with the potential
Table 2 Bond lengths and
coordination numbers of Pt and
Rh metals in the Pt–Rh–SnO 2 /C
catalyst held at 0.41 V in 1 M
HClO 4 obtained by the firstshell fitting and comparison to
those of bulk metals (from Ref.
[84])
Bond length (A)
Coordination number
Pt (bulk)
2.775
12
Rh (bulk)
2.689
12
Pt–Pt
2.740 ± 0.004
5.1 ± 0.9
Rh–Rh
2.683 ± 0.006
1.9 ± 0.9
Pt–Rh
2.715 ± 0.004
1.7 ± 0.9
Rh–Pt
2.715 ± 0.004
5.1 ± 1.0
Fig. 16 In situ XANES spectra of Pt L 3 and Ir L 3 edges of PtIr/SnO 2 /C electrocatalyst under different
applied potentials. Reprinted from Ref. [31] with permission from American Chemical Society
Reprinted from the journal
28
1 3
Our studies on several Pt–Ir–SnO 2 catalysts indicated that Ir could split the
C–C bond in ethanol [31]. While it was difficult to obtain the internal structure of
the nanoparticles with Ir and Pt due to the close proximity of their L 3 edges, the
XANES spectra can be used to reveal the mole ratio of the two metals. In our study
of the catalyst with Pt:Ir:Sn = 1:1:1 atomic ratio, we found that the edge step (Δμ 0 ,
cf. Fig. 2) of Ir L 3 and Pt L 3 are approximately equal (both ca. 0.5). Because their
absorption intensities are close, the Pt/Ir ratio is approximately 1, which is consistent with the nominal value [111].
Furthermore, XANES spectra showed that Ir were in oxidized state even at the
lowest potentials. As seen in Fig. 16, both Ir and Pt spectra show a dependence of
the white lines on potential, indicating oxidation of both metals with the potential
Table 2 Bond lengths and
coordination numbers of Pt and
Rh metals in the Pt–Rh–SnO 2 /C
catalyst held at 0.41 V in 1 M
HClO 4 obtained by the firstshell fitting and comparison to
those of bulk metals (from Ref.
[84])
Bond length (A)
Coordination number
Pt (bulk)
2.775
12
Rh (bulk)
2.689
12
Pt–Pt
2.740 ± 0.004
5.1 ± 0.9
Rh–Rh
2.683 ± 0.006
1.9 ± 0.9
Pt–Rh
2.715 ± 0.004
1.7 ± 0.9
Rh–Pt
2.715 ± 0.004
5.1 ± 1.0
Fig. 16 In situ XANES spectra of Pt L 3 and Ir L 3 edges of PtIr/SnO 2 /C electrocatalyst under different
applied potentials. Reprinted from Ref. [31] with permission from American Chemical Society
Reprinted from the journal
28