

1 3
Topics in Current Chemistry (2019) 377:11
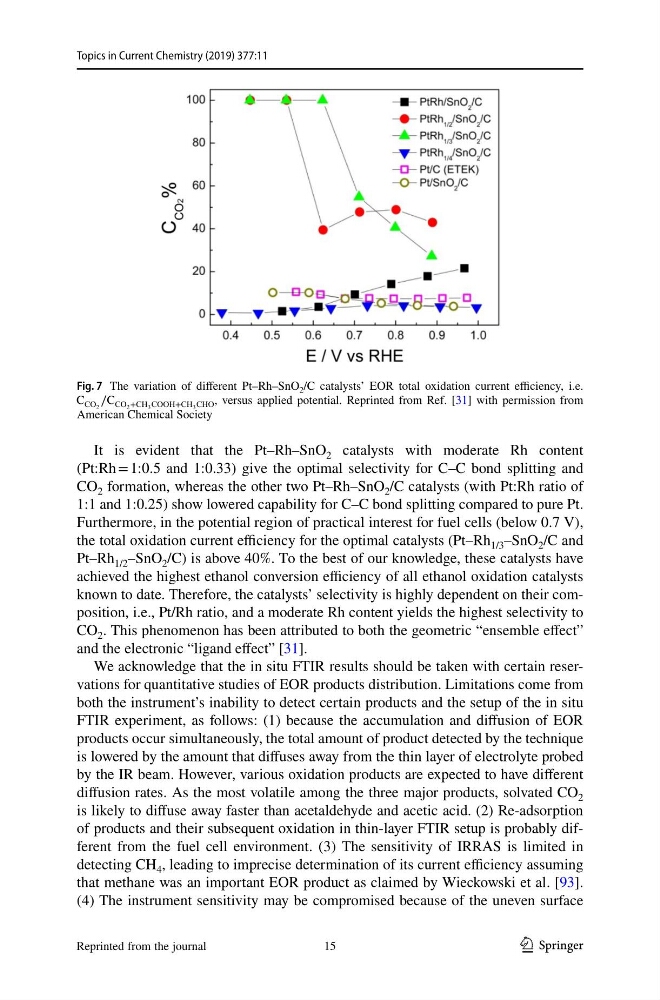
It is evident that the Pt–Rh–SnO 2 catalysts with moderate Rh content
(Pt:Rh = 1:0.5 and 1:0.33) give the optimal selectivity for C–C bond splitting and
CO 2 formation, whereas the other two Pt–Rh–SnO 2 /C catalysts (with Pt:Rh ratio of
1:1 and 1:0.25) show lowered capability for C–C bond splitting compared to pure Pt.
Furthermore, in the potential region of practical interest for fuel cells (below 0.7 V),
the total oxidation current efficiency for the optimal catalysts (Pt–Rh 1/3 –SnO 2 /C and
Pt–Rh 1/2 –SnO 2 /C) is above 40%. To the best of our knowledge, these catalysts have
achieved the highest ethanol conversion efficiency of all ethanol oxidation catalysts
known to date. Therefore, the catalysts’ selectivity is highly dependent on their composition, i.e., Pt/Rh ratio, and a moderate Rh content yields the highest selectivity to
CO 2 . This phenomenon has been attributed to both the geometric “ensemble effect”
and the electronic “ligand effect” [31].
We acknowledge that the in situ FTIR results should be taken with certain reservations for quantitative studies of EOR products distribution. Limitations come from
both the instrument’s inability to detect certain products and the setup of the in situ
FTIR experiment, as follows: (1) because the accumulation and diffusion of EOR
products occur simultaneously, the total amount of product detected by the technique
is lowered by the amount that diffuses away from the thin layer of electrolyte probed
by the IR beam. However, various oxidation products are expected to have different
diffusion rates. As the most volatile among the three major products, solvated CO 2
is likely to diffuse away faster than acetaldehyde and acetic acid. (2) Re-adsorption
of products and their subsequent oxidation in thin-layer FTIR setup is probably different from the fuel cell environment. (3) The sensitivity of IRRAS is limited in
detecting CH 4 , leading to imprecise determination of its current efficiency assuming
that methane was an important EOR product as claimed by Wieckowski et al. [93].
(4) The instrument sensitivity may be compromised because of the uneven surface
Fig. 7 The variation of different Pt–Rh–SnO 2 /C catalysts’ EOR total oxidation current efficiency, i.e.
C CO 2 ∕C CO 2 +CH 3 COOH+CH 3 CHO , versus applied potential. Reprinted from Ref. [31] with permission from
American Chemical Society
Reprinted from the journal
15
Topics in Current Chemistry (2019) 377:11
It is evident that the Pt–Rh–SnO 2 catalysts with moderate Rh content
(Pt:Rh = 1:0.5 and 1:0.33) give the optimal selectivity for C–C bond splitting and
CO 2 formation, whereas the other two Pt–Rh–SnO 2 /C catalysts (with Pt:Rh ratio of
1:1 and 1:0.25) show lowered capability for C–C bond splitting compared to pure Pt.
Furthermore, in the potential region of practical interest for fuel cells (below 0.7 V),
the total oxidation current efficiency for the optimal catalysts (Pt–Rh 1/3 –SnO 2 /C and
Pt–Rh 1/2 –SnO 2 /C) is above 40%. To the best of our knowledge, these catalysts have
achieved the highest ethanol conversion efficiency of all ethanol oxidation catalysts
known to date. Therefore, the catalysts’ selectivity is highly dependent on their composition, i.e., Pt/Rh ratio, and a moderate Rh content yields the highest selectivity to
CO 2 . This phenomenon has been attributed to both the geometric “ensemble effect”
and the electronic “ligand effect” [31].
We acknowledge that the in situ FTIR results should be taken with certain reservations for quantitative studies of EOR products distribution. Limitations come from
both the instrument’s inability to detect certain products and the setup of the in situ
FTIR experiment, as follows: (1) because the accumulation and diffusion of EOR
products occur simultaneously, the total amount of product detected by the technique
is lowered by the amount that diffuses away from the thin layer of electrolyte probed
by the IR beam. However, various oxidation products are expected to have different
diffusion rates. As the most volatile among the three major products, solvated CO 2
is likely to diffuse away faster than acetaldehyde and acetic acid. (2) Re-adsorption
of products and their subsequent oxidation in thin-layer FTIR setup is probably different from the fuel cell environment. (3) The sensitivity of IRRAS is limited in
detecting CH 4 , leading to imprecise determination of its current efficiency assuming
that methane was an important EOR product as claimed by Wieckowski et al. [93].
(4) The instrument sensitivity may be compromised because of the uneven surface
Fig. 7 The variation of different Pt–Rh–SnO 2 /C catalysts’ EOR total oxidation current efficiency, i.e.
C CO 2 ∕C CO 2 +CH 3 COOH+CH 3 CHO , versus applied potential. Reprinted from Ref. [31] with permission from
American Chemical Society
Reprinted from the journal
15