

Prior to the experiments, the samples were regenerated at 350
C overnight under
He flow. Samples were heated to the regeneration temperature using a ramp of 1
C/
min to 110
C first, followed by a second ramp to 350
C.
The first evidence of a slow diffusion process is the fact that the adsorbed amount
is highly dependent on the adsorption time. In practice, the calculated adsorbed
amount from the ZLC desorption curve would increase with the adsorption time
indicating that the sample has not reached full equilibration. In this case the true
equilibration time can be determined by running adsorption/desorption tests at
increasing adsorption times. Full equilibration is achieved once the calculated
adsorption capacity would not change any more with the adsorption time, and
after the diffusion time constant was obtained, it was confirmed that the equilibration
time exceeded 0.5R
2 /D. This is a key step in the initial assessment of slow samples,
and it is always good practice to have a way to check that equilibrium has been
achieved, especially when dealing with novel materials. The final CO 2 adsorbed
amount at 35
C and 0.1 bar is 2.13 mol/kg for Na,Cs-Rho and 3.22 mol/kg for
Na-Rho.
It should also be noted that the monitored variable is the concentration in the gas
phase. This means that for very slow samples relying on the trend of the monitored
signal may not be enough to ensure that the system is at equilibrium. A stable plateau
in the recorded signal does not automatically indicate that equilibrium has been
reached in the adsorbed phase. Therefore, the approach suggested above of calculating the adsorbed amount at different exposure times constitutes a more reliable
check. Equilibration time for the Rho samples tested was between 5 and 7 h.
The first step when trying to measure kinetics is to ensure that the system is under
kinetic limitation. The long equilibration time is already an indication per se of the
presence of a transport resistance, but, as mentioned above, the ZLC offers also a
simple graphical check for equilibrium/kinetic control by plotting the desorption
curve in terms of eluted volume, Ft [8]. Figure 8 shows both the t and the
corresponding Ft plot for the Na,Cs-Rho sample. ZLC curves at different flowrates
clearly cross in the Ft plot proving that the system is in kinetically controlled regime.
When dealing with very slow kinetics, the interpretation of the ZLC experiments
requires a careful analysis of the ZLC desorption curves as the identification of the
long-time asymptote can lead to misleading kinetic constants. In Fig. 8 it is clear that,
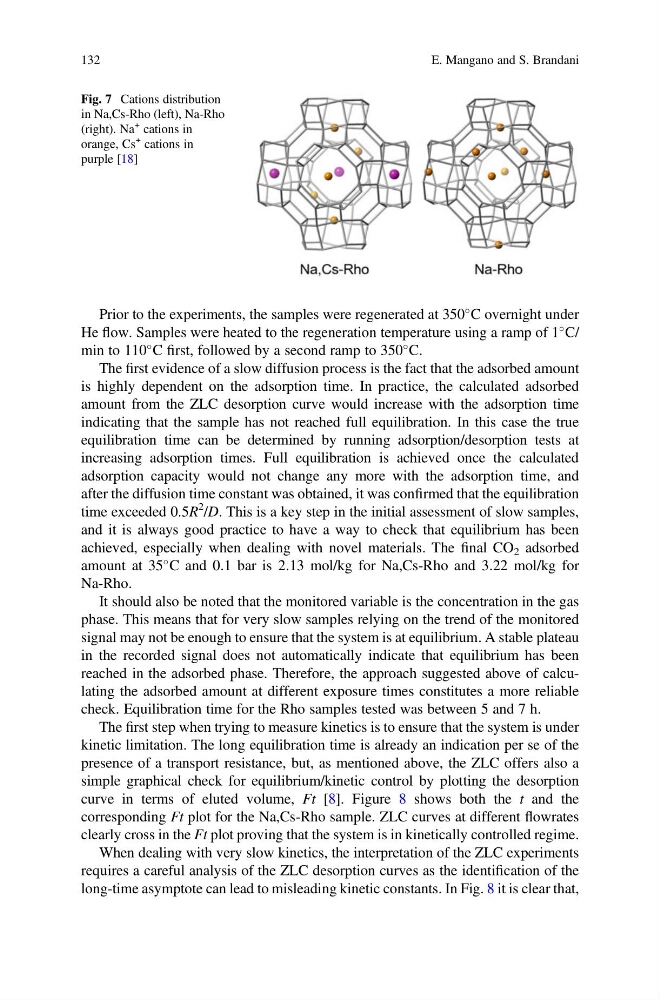
Fig. 7 Cations distribution
in Na,Cs-Rho (left), Na-Rho
(right). Na
+ cations in
orange, Cs
+ cations in
purple [18]
132
E. Mangano and S. Brandani
C overnight under
He flow. Samples were heated to the regeneration temperature using a ramp of 1
C/
min to 110
C first, followed by a second ramp to 350
C.
The first evidence of a slow diffusion process is the fact that the adsorbed amount
is highly dependent on the adsorption time. In practice, the calculated adsorbed
amount from the ZLC desorption curve would increase with the adsorption time
indicating that the sample has not reached full equilibration. In this case the true
equilibration time can be determined by running adsorption/desorption tests at
increasing adsorption times. Full equilibration is achieved once the calculated
adsorption capacity would not change any more with the adsorption time, and
after the diffusion time constant was obtained, it was confirmed that the equilibration
time exceeded 0.5R
2 /D. This is a key step in the initial assessment of slow samples,
and it is always good practice to have a way to check that equilibrium has been
achieved, especially when dealing with novel materials. The final CO 2 adsorbed
amount at 35
C and 0.1 bar is 2.13 mol/kg for Na,Cs-Rho and 3.22 mol/kg for
Na-Rho.
It should also be noted that the monitored variable is the concentration in the gas
phase. This means that for very slow samples relying on the trend of the monitored
signal may not be enough to ensure that the system is at equilibrium. A stable plateau
in the recorded signal does not automatically indicate that equilibrium has been
reached in the adsorbed phase. Therefore, the approach suggested above of calculating the adsorbed amount at different exposure times constitutes a more reliable
check. Equilibration time for the Rho samples tested was between 5 and 7 h.
The first step when trying to measure kinetics is to ensure that the system is under
kinetic limitation. The long equilibration time is already an indication per se of the
presence of a transport resistance, but, as mentioned above, the ZLC offers also a
simple graphical check for equilibrium/kinetic control by plotting the desorption
curve in terms of eluted volume, Ft [8]. Figure 8 shows both the t and the
corresponding Ft plot for the Na,Cs-Rho sample. ZLC curves at different flowrates
clearly cross in the Ft plot proving that the system is in kinetically controlled regime.
When dealing with very slow kinetics, the interpretation of the ZLC experiments
requires a careful analysis of the ZLC desorption curves as the identification of the
long-time asymptote can lead to misleading kinetic constants. In Fig. 8 it is clear that,
Fig. 7 Cations distribution
in Na,Cs-Rho (left), Na-Rho
(right). Na
+ cations in
orange, Cs
+ cations in
purple [18]
132
E. Mangano and S. Brandani