

3.3.2 Mesopore Size Distribution
The mesopore size distribution of zeolitic materials can be evaluated with the
classical BJH method; however, it is known that BJH underestimates the mesopore
size up to a 25% [53]. For this reason, methods such as VBS have been developed
[54], and the results obtained with it coincides with the value predicted using DFT,
with the advantage of being applicable without a specific kernel or software.
As example, we will analyze N 2 adsorption isotherm at 77 K shown previously
for the HY-CTAB sample (Figs. 10a and 11) to obtain its PSD. From this isotherm, it
can be seen that the capillary condensation in mesopores begins at relative pressures
ca. 0.3 which could be associated with the primary mesoporosity (pores in the
structure).
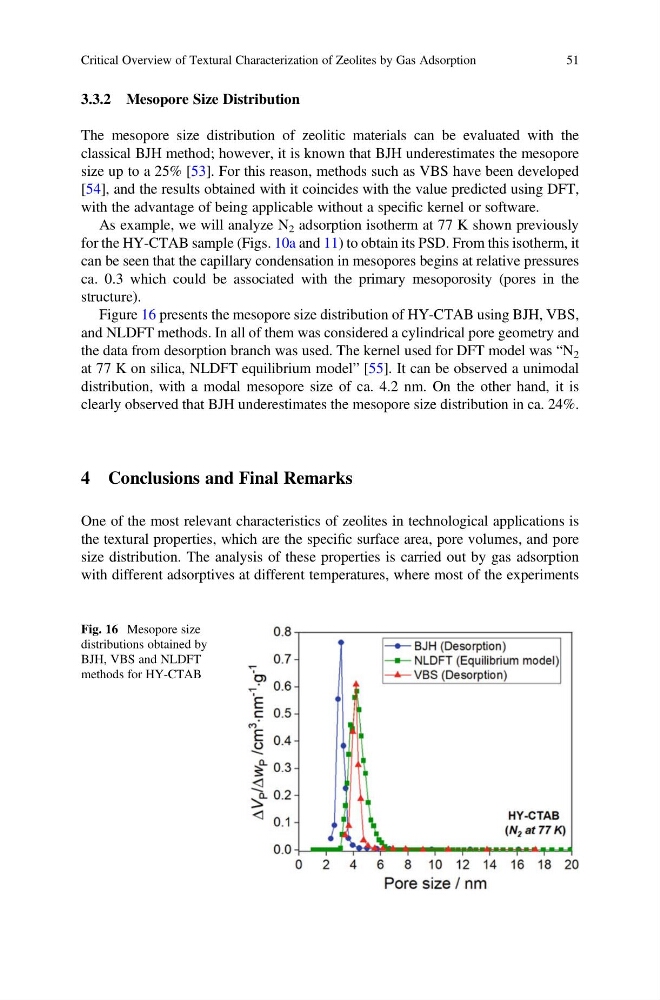
Figure 16 presents the mesopore size distribution of HY-CTAB using BJH, VBS,
and NLDFT methods. In all of them was considered a cylindrical pore geometry and
the data from desorption branch was used. The kernel used for DFT model was “N 2
at 77 K on silica, NLDFT equilibrium model” [55]. It can be observed a unimodal
distribution, with a modal mesopore size of ca. 4.2 nm. On the other hand, it is
clearly observed that BJH underestimates the mesopore size distribution in ca. 24%.
4 Conclusions and Final Remarks
One of the most relevant characteristics of zeolites in technological applications is
the textural properties, which are the specific surface area, pore volumes, and pore
size distribution. The analysis of these properties is carried out by gas adsorption
with different adsorptives at different temperatures, where most of the experiments
Fig. 16 Mesopore size
distributions obtained by
BJH, VBS and NLDFT
methods for HY-CTAB
Critical Overview of Textural Characterization of Zeolites by Gas Adsorption
51
The mesopore size distribution of zeolitic materials can be evaluated with the
classical BJH method; however, it is known that BJH underestimates the mesopore
size up to a 25% [53]. For this reason, methods such as VBS have been developed
[54], and the results obtained with it coincides with the value predicted using DFT,
with the advantage of being applicable without a specific kernel or software.
As example, we will analyze N 2 adsorption isotherm at 77 K shown previously
for the HY-CTAB sample (Figs. 10a and 11) to obtain its PSD. From this isotherm, it
can be seen that the capillary condensation in mesopores begins at relative pressures
ca. 0.3 which could be associated with the primary mesoporosity (pores in the
structure).
Figure 16 presents the mesopore size distribution of HY-CTAB using BJH, VBS,
and NLDFT methods. In all of them was considered a cylindrical pore geometry and
the data from desorption branch was used. The kernel used for DFT model was “N 2
at 77 K on silica, NLDFT equilibrium model” [55]. It can be observed a unimodal
distribution, with a modal mesopore size of ca. 4.2 nm. On the other hand, it is
clearly observed that BJH underestimates the mesopore size distribution in ca. 24%.
4 Conclusions and Final Remarks
One of the most relevant characteristics of zeolites in technological applications is
the textural properties, which are the specific surface area, pore volumes, and pore
size distribution. The analysis of these properties is carried out by gas adsorption
with different adsorptives at different temperatures, where most of the experiments
Fig. 16 Mesopore size
distributions obtained by
BJH, VBS and NLDFT
methods for HY-CTAB
Critical Overview of Textural Characterization of Zeolites by Gas Adsorption
51