

given the slow rate of diffusion, the desorption curves show a clear signal with a
slowly varying exponential decay for several hours, making it difficult to assess
where the long-time asymptote should be taken to extract the kinetic constant. An
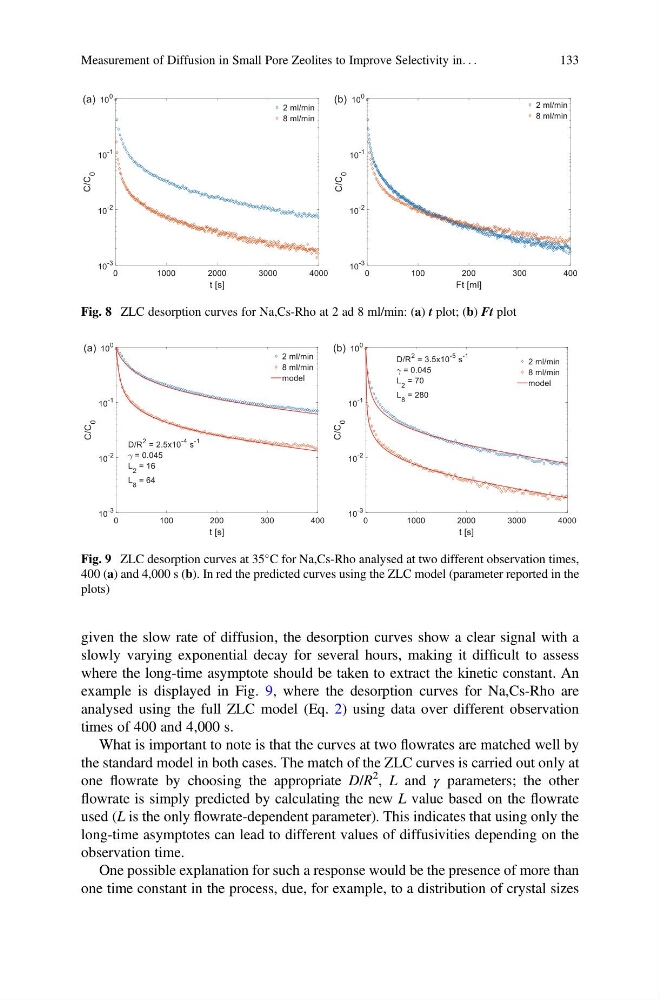
example is displayed in Fig. 9, where the desorption curves for Na,Cs-Rho are
analysed using the full ZLC model (Eq. 2) using data over different observation
times of 400 and 4,000 s.
What is important to note is that the curves at two flowrates are matched well by
the standard model in both cases. The match of the ZLC curves is carried out only at
one flowrate by choosing the appropriate D/R
2 , L and γ parameters; the other
flowrate is simply predicted by calculating the new L value based on the flowrate
used (L is the only flowrate-dependent parameter). This indicates that using only the
long-time asymptotes can lead to different values of diffusivities depending on the
observation time.
One possible explanation for such a response would be the presence of more than
one time constant in the process, due, for example, to a distribution of crystal sizes
Fig. 8 ZLC desorption curves for Na,Cs-Rho at 2 ad 8 ml/min: (a) t plot; (b) Ft plot
Fig. 9 ZLC desorption curves at 35
C for Na,Cs-Rho analysed at two different observation times,
400 (a) and 4,000 s (b). In red the predicted curves using the ZLC model (parameter reported in the
plots)
Measurement of Diffusion in Small Pore Zeolites to Improve Selectivity in. . .
133
slowly varying exponential decay for several hours, making it difficult to assess
where the long-time asymptote should be taken to extract the kinetic constant. An
example is displayed in Fig. 9, where the desorption curves for Na,Cs-Rho are
analysed using the full ZLC model (Eq. 2) using data over different observation
times of 400 and 4,000 s.
What is important to note is that the curves at two flowrates are matched well by
the standard model in both cases. The match of the ZLC curves is carried out only at
one flowrate by choosing the appropriate D/R
2 , L and γ parameters; the other
flowrate is simply predicted by calculating the new L value based on the flowrate
used (L is the only flowrate-dependent parameter). This indicates that using only the
long-time asymptotes can lead to different values of diffusivities depending on the
observation time.
One possible explanation for such a response would be the presence of more than
one time constant in the process, due, for example, to a distribution of crystal sizes
Fig. 8 ZLC desorption curves for Na,Cs-Rho at 2 ad 8 ml/min: (a) t plot; (b) Ft plot
Fig. 9 ZLC desorption curves at 35
C for Na,Cs-Rho analysed at two different observation times,
400 (a) and 4,000 s (b). In red the predicted curves using the ZLC model (parameter reported in the
plots)
Measurement of Diffusion in Small Pore Zeolites to Improve Selectivity in. . .
133