

tremendously to the creation of stable soil aggregates (Pietz et al. 1984; Sharma et al.
2017).
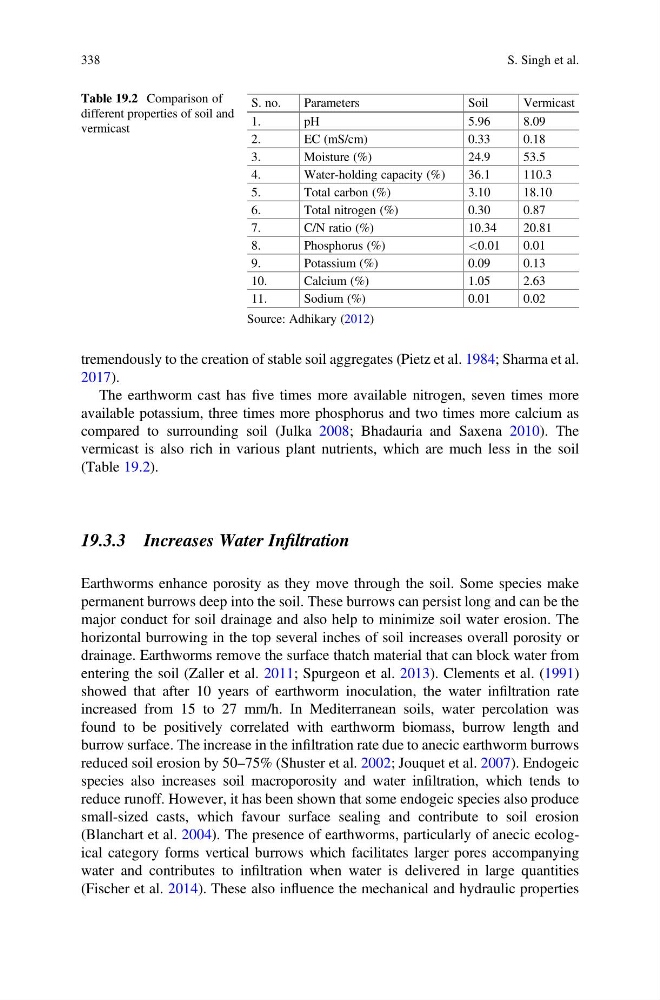
The earthworm cast has five times more available nitrogen, seven times more
available potassium, three times more phosphorus and two times more calcium as
compared to surrounding soil (Julka 2008; Bhadauria and Saxena 2010). The
vermicast is also rich in various plant nutrients, which are much less in the soil
(Table 19.2).
19.3.3 Increases Water Infiltration
Earthworms enhance porosity as they move through the soil. Some species make
permanent burrows deep into the soil. These burrows can persist long and can be the
major conduct for soil drainage and also help to minimize soil water erosion. The
horizontal burrowing in the top several inches of soil increases overall porosity or
drainage. Earthworms remove the surface thatch material that can block water from
entering the soil (Zaller et al. 2011; Spurgeon et al. 2013). Clements et al. (1991)
showed that after 10 years of earthworm inoculation, the water infiltration rate
increased from 15 to 27 mm/h. In Mediterranean soils, water percolation was
found to be positively correlated with earthworm biomass, burrow length and
burrow surface. The increase in the infiltration rate due to anecic earthworm burrows
reduced soil erosion by 50–75% (Shuster et al. 2002; Jouquet et al. 2007). Endogeic
species also increases soil macroporosity and water infiltration, which tends to
reduce runoff. However, it has been shown that some endogeic species also produce
small-sized casts, which favour surface sealing and contribute to soil erosion
(Blanchart et al. 2004). The presence of earthworms, particularly of anecic ecological category forms vertical burrows which facilitates larger pores accompanying
water and contributes to infiltration when water is delivered in large quantities
(Fischer et al. 2014). These also influence the mechanical and hydraulic properties
Table 19.2 Comparison of
different properties of soil and
vermicast
S. no.
Parameters
Soil
Vermicast
1.
pH
5.96
8.09
2.
EC (mS/cm)
0.33
0.18
3.
Moisture (%)
24.9
53.5
4.
Water-holding capacity (%)
36.1
110.3
5.
Total carbon (%)
3.10
18.10
6.
Total nitrogen (%)
0.30
0.87
7.
C/N ratio (%)
10.34
20.81
8.
Phosphorus (%)
<0.01
0.01
9.
Potassium (%)
0.09
0.13
10.
Calcium (%)
1.05
2.63
11.
Sodium (%)
0.01
0.02
Source: Adhikary (2012)
338
S. Singh et al.
2017).
The earthworm cast has five times more available nitrogen, seven times more
available potassium, three times more phosphorus and two times more calcium as
compared to surrounding soil (Julka 2008; Bhadauria and Saxena 2010). The
vermicast is also rich in various plant nutrients, which are much less in the soil
(Table 19.2).
19.3.3 Increases Water Infiltration
Earthworms enhance porosity as they move through the soil. Some species make
permanent burrows deep into the soil. These burrows can persist long and can be the
major conduct for soil drainage and also help to minimize soil water erosion. The
horizontal burrowing in the top several inches of soil increases overall porosity or
drainage. Earthworms remove the surface thatch material that can block water from
entering the soil (Zaller et al. 2011; Spurgeon et al. 2013). Clements et al. (1991)
showed that after 10 years of earthworm inoculation, the water infiltration rate
increased from 15 to 27 mm/h. In Mediterranean soils, water percolation was
found to be positively correlated with earthworm biomass, burrow length and
burrow surface. The increase in the infiltration rate due to anecic earthworm burrows
reduced soil erosion by 50–75% (Shuster et al. 2002; Jouquet et al. 2007). Endogeic
species also increases soil macroporosity and water infiltration, which tends to
reduce runoff. However, it has been shown that some endogeic species also produce
small-sized casts, which favour surface sealing and contribute to soil erosion
(Blanchart et al. 2004). The presence of earthworms, particularly of anecic ecological category forms vertical burrows which facilitates larger pores accompanying
water and contributes to infiltration when water is delivered in large quantities
(Fischer et al. 2014). These also influence the mechanical and hydraulic properties
Table 19.2 Comparison of
different properties of soil and
vermicast
S. no.
Parameters
Soil
Vermicast
1.
pH
5.96
8.09
2.
EC (mS/cm)
0.33
0.18
3.
Moisture (%)
24.9
53.5
4.
Water-holding capacity (%)
36.1
110.3
5.
Total carbon (%)
3.10
18.10
6.
Total nitrogen (%)
0.30
0.87
7.
C/N ratio (%)
10.34
20.81
8.
Phosphorus (%)
<0.01
0.01
9.
Potassium (%)
0.09
0.13
10.
Calcium (%)
1.05
2.63
11.
Sodium (%)
0.01
0.02
Source: Adhikary (2012)
338
S. Singh et al.