

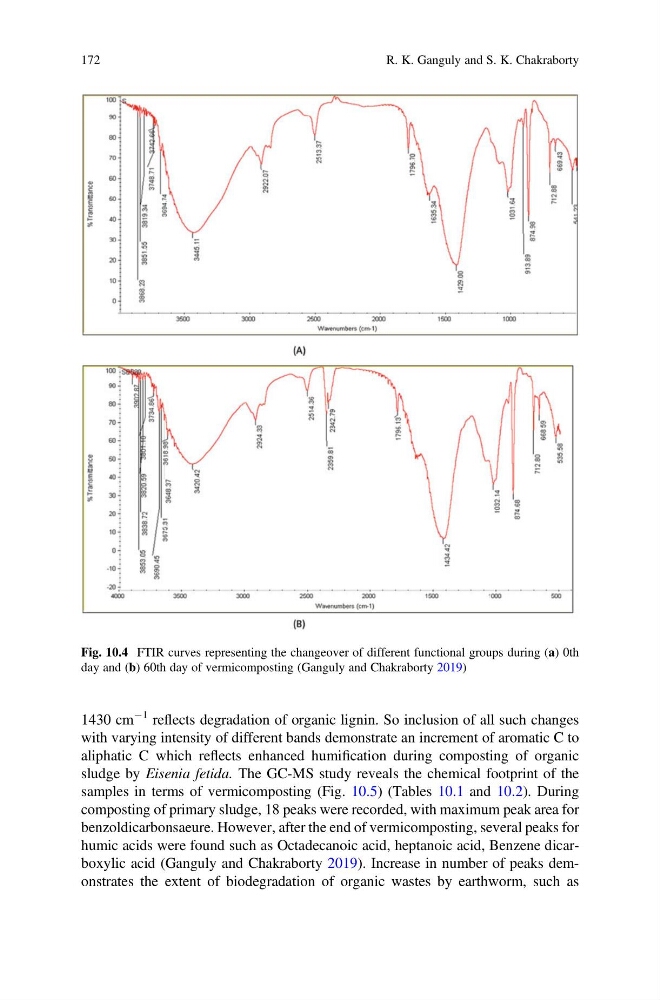
1430 cm
À1 reflects degradation of organic lignin. So inclusion of all such changes
with varying intensity of different bands demonstrate an increment of aromatic C to
aliphatic C which reflects enhanced humification during composting of organic
sludge by Eisenia fetida. The GC-MS study reveals the chemical footprint of the
samples in terms of vermicomposting (Fig. 10.5) (Tables 10.1 and 10.2). During
composting of primary sludge, 18 peaks were recorded, with maximum peak area for
benzoldicarbonsaeure. However, after the end of vermicomposting, several peaks for
humic acids were found such as Octadecanoic acid, heptanoic acid, Benzene dicarboxylic acid (Ganguly and Chakraborty 2019). Increase in number of peaks demonstrates the extent of biodegradation of organic wastes by earthworm, such as
Fig. 10.4 FTIR curves representing the changeover of different functional groups during (a) 0th
day and (b) 60th day of vermicomposting (Ganguly and Chakraborty 2019)
172
R. K. Ganguly and S. K. Chakraborty
À1 reflects degradation of organic lignin. So inclusion of all such changes
with varying intensity of different bands demonstrate an increment of aromatic C to
aliphatic C which reflects enhanced humification during composting of organic
sludge by Eisenia fetida. The GC-MS study reveals the chemical footprint of the
samples in terms of vermicomposting (Fig. 10.5) (Tables 10.1 and 10.2). During
composting of primary sludge, 18 peaks were recorded, with maximum peak area for
benzoldicarbonsaeure. However, after the end of vermicomposting, several peaks for
humic acids were found such as Octadecanoic acid, heptanoic acid, Benzene dicarboxylic acid (Ganguly and Chakraborty 2019). Increase in number of peaks demonstrates the extent of biodegradation of organic wastes by earthworm, such as
Fig. 10.4 FTIR curves representing the changeover of different functional groups during (a) 0th
day and (b) 60th day of vermicomposting (Ganguly and Chakraborty 2019)
172
R. K. Ganguly and S. K. Chakraborty