

0.2
50
25
0
Relative abundance (%)
100
75
Actinobacteria
Planctomycetes
Bacteroidetes
Proteobacteria
Verrucomicrobia
Firmicutes
Low abundance (<1%)
Raw materials
Vermicomposts
Grape marc
Grape marc
Distilled grape marc
Acacia
Scotch broom
Scotch broom
Distilled grape marc
Acacia
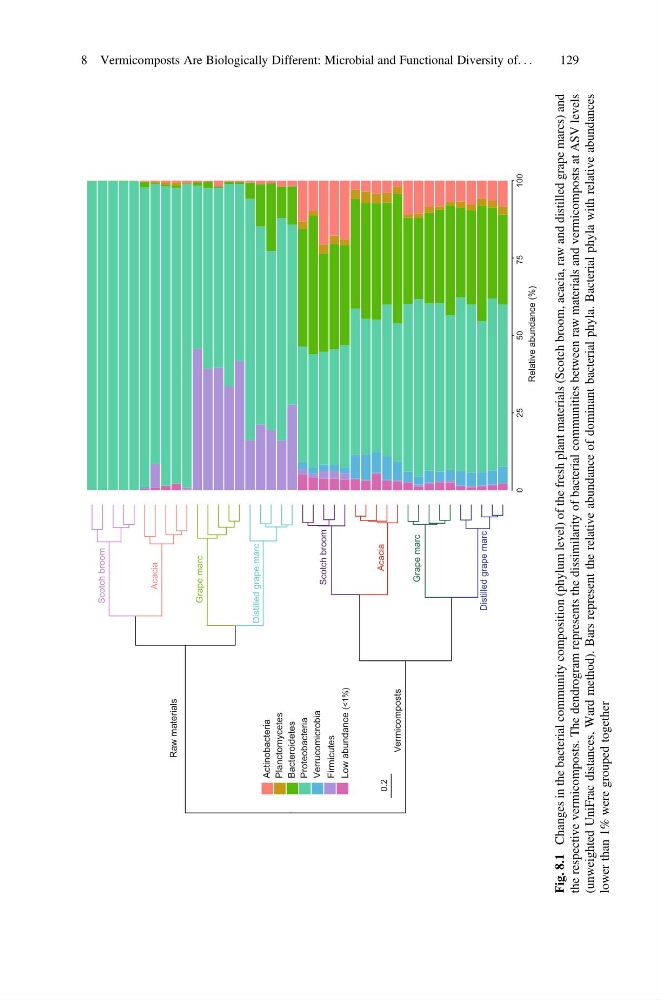
Fig. 8.1
Changes in the bacterial community composition (phylum level) of the fresh plant materials (Scotch broom, acacia, raw and distilled grape marcs) and
the respective vermicomposts. The dendrogram represents the dissimilarity of bacterial communities between raw materials and vermicomposts at ASV levels
(unweighted UniFrac distances, Ward method). Bars represent the relative abundance of dominant bacterial phyla. Bacterial phyla with relative abundances
lower than 1% were grouped together
8 Vermicomposts Are Biologically Different: Microbial and Functional Diversity of. . .
129
50
25
0
Relative abundance (%)
100
75
Actinobacteria
Planctomycetes
Bacteroidetes
Proteobacteria
Verrucomicrobia
Firmicutes
Low abundance (<1%)
Raw materials
Vermicomposts
Grape marc
Grape marc
Distilled grape marc
Acacia
Scotch broom
Scotch broom
Distilled grape marc
Acacia
Fig. 8.1
Changes in the bacterial community composition (phylum level) of the fresh plant materials (Scotch broom, acacia, raw and distilled grape marcs) and
the respective vermicomposts. The dendrogram represents the dissimilarity of bacterial communities between raw materials and vermicomposts at ASV levels
(unweighted UniFrac distances, Ward method). Bars represent the relative abundance of dominant bacterial phyla. Bacterial phyla with relative abundances
lower than 1% were grouped together
8 Vermicomposts Are Biologically Different: Microbial and Functional Diversity of. . .
129