

559
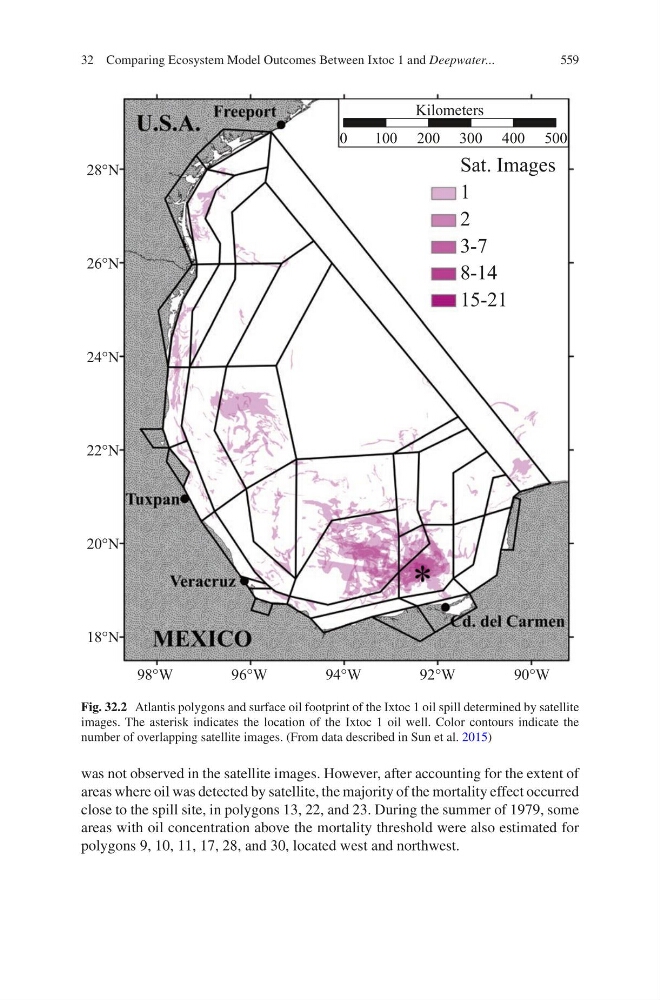
was not observed in the satellite images. However, after accounting for the extent of
areas where oil was detected by satellite, the majority of the mortality effect occurred
close to the spill site, in polygons 13, 22, and 23. During the summer of 1979, some
areas with oil concentration above the mortality threshold were also estimated for
polygons 9, 10, 11, 17, 28, and 30, located west and northwest.
:
:
:
:
:
1
1
1
1
1
1
6DW,PDJHV
.LORPHWHUV
Fig. 32.2 Atlantis polygons and surface oil footprint of the Ixtoc 1 oil spill determined by satellite
images. The asterisk indicates the location of the Ixtoc 1 oil well. Color contours indicate the
number of overlapping satellite images. (From data described in Sun et al. 2015)
32 Comparing Ecosystem Model Outcomes Between Ixtoc 1 and Deepwater...