

382
23.3.3 Resilience
There was evidence of recovery in benthic foraminiferal density and diversity after
the IL at different times in the three studied cores. In core IXW250, density values
were clearly higher before the IL than after it, indicating there has not been a recovery in the density of benthic foraminifera at this site. Species richness did not vary
considerably (between 14 and 33) and reached higher values (near pre-IL), approximately 15 years after the Ixtoc 1 oil spill. Heterogeneity decreased within the IL and
remained near down-core mean values for approximately the next 10 years, reaching above mean values around 1990. In core IXW500, density did not recover (mean
post-IL values are lower than pre-IL), as in core IXW250, but species richness and
particularly heterogeneity values recovered to pre-IL values within 5 years after the
IL similar to northern GoM records following DWH. However, species richness
values were not constant throughout the core, and the trend was erratic. Core
IXW750 was the only record where density recovered to higher than pre-IL values,
which occurs almost 20 years after the IL. Species richness and heterogeneity
increased immediately following the IL and then decreased below the core mean.
The recovery time (higher than pre-IL values) for both records was on the order of
15–17 years. Therefore the recovery of density from Ixtoc 1 revealed that the effects
were proportional to the distance to the wellhead. Diversity trends were not as clear.
A larger suite of samples could reveal clearer trends.
IXW Transect d
13
C CaCO3 (‰)
-0.3
0.2
0.7
1 .2
IXW500A
0
0.2 0.4 0.6 0.8
1
1.2
IXW750A
0
10
20
30
40
50
60
70
80
0
0.5
1
Depth (mm)
IXW250
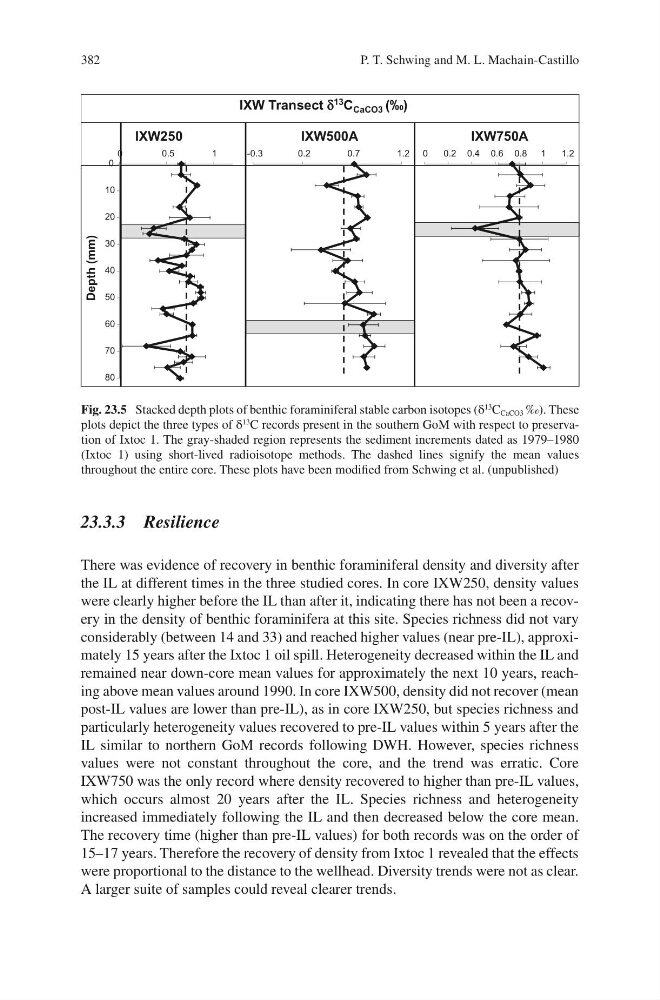
Fig. 23.5 Stacked depth plots of benthic foraminiferal stable carbon isotopes (δ
13
C CaCO3 ‰). These
plots depict the three types of δ
13 C records present in the southern GoM with respect to preservation of Ixtoc 1. The gray-shaded region represents the sediment increments dated as 1979–1980
(Ixtoc 1) using short-lived radioisotope methods. The dashed lines signify the mean values
throughout the entire core. These plots have been modified from Schwing et al. (unpublished)
P. T. Schwing and M. L. Machain-Castillo
23.3.3 Resilience
There was evidence of recovery in benthic foraminiferal density and diversity after
the IL at different times in the three studied cores. In core IXW250, density values
were clearly higher before the IL than after it, indicating there has not been a recovery in the density of benthic foraminifera at this site. Species richness did not vary
considerably (between 14 and 33) and reached higher values (near pre-IL), approximately 15 years after the Ixtoc 1 oil spill. Heterogeneity decreased within the IL and
remained near down-core mean values for approximately the next 10 years, reaching above mean values around 1990. In core IXW500, density did not recover (mean
post-IL values are lower than pre-IL), as in core IXW250, but species richness and
particularly heterogeneity values recovered to pre-IL values within 5 years after the
IL similar to northern GoM records following DWH. However, species richness
values were not constant throughout the core, and the trend was erratic. Core
IXW750 was the only record where density recovered to higher than pre-IL values,
which occurs almost 20 years after the IL. Species richness and heterogeneity
increased immediately following the IL and then decreased below the core mean.
The recovery time (higher than pre-IL values) for both records was on the order of
15–17 years. Therefore the recovery of density from Ixtoc 1 revealed that the effects
were proportional to the distance to the wellhead. Diversity trends were not as clear.
A larger suite of samples could reveal clearer trends.
IXW Transect d
13
C CaCO3 (‰)
-0.3
0.2
0.7
1 .2
IXW500A
0
0.2 0.4 0.6 0.8
1
1.2
IXW750A
0
10
20
30
40
50
60
70
80
0
0.5
1
Depth (mm)
IXW250
Fig. 23.5 Stacked depth plots of benthic foraminiferal stable carbon isotopes (δ
13
C CaCO3 ‰). These
plots depict the three types of δ
13 C records present in the southern GoM with respect to preservation of Ixtoc 1. The gray-shaded region represents the sediment increments dated as 1979–1980
(Ixtoc 1) using short-lived radioisotope methods. The dashed lines signify the mean values
throughout the entire core. These plots have been modified from Schwing et al. (unpublished)
P. T. Schwing and M. L. Machain-Castillo